Volvo 1998 Annual Report Download - page 97
Download and view the complete annual report
Please find page 97 of the 1998 Volvo annual report below. You can navigate through the pages in the report by either clicking on the pages listed below, or by using the keyword search tool below to find specific information within the annual report.-
 1
1 -
2
-
3
-
4
-
5
-
6
-
7
-
8
-
9
-
10
-
11
-
12
-
13
-
14
-
15
-
16
-
17
-
18
-
19
-
20
-
21
-
22
-
23
-
24
-
25
-
26
-
27
-
28
-
29
-
30
-
31
-
32
-
33
-
34
-
35
-
36
-
37
-
38
-
39
-
40
-
41
-
42
-
43
-
44
-
45
-
46
-
47
-
48
-
49
-
50
-
51
-
52
-
53
-
54
-
55
-
56
-
57
-
58
-
59
-
60
-
61
-
62
-
63
-
64
-
65
-
66
-
67
-
68
-
69
-
70
-
71
-
72
-
73
-
74
-
75
-
76
-
77
-
78
-
79
-
80
-
81
-
82
-
83
-
84
-
85
-
86
-
 87
87 -
 88
88 -
 89
89 -
 90
90 -
 91
91 -
 92
92 -
 93
93 -
 94
94 -
 95
95 -
 96
96 -
 97
97 -
 98
98 -
 99
99 -
 100
100 -
 101
101 -
 102
102 -
 103
103 -
 104
104 -
 105
105 -
 106
106 -
 107
107 -
108
-
109
-
110
-
111
-
112
 |
 |

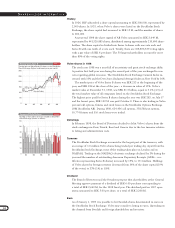
95
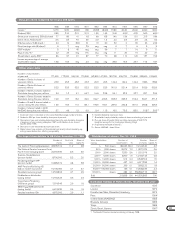
1988 1989 1990 1991 1992 1993 1994 1995 1996 1997 1998
Income 112.70 12.30 (2.60) 1.80 (8.60) (8.90) 31.80 20.20 26.90 22.90 19.60
Dividend, SEK 2.80 3.10 3.10 3.10 1.55 1.55 3.40 4.00 84.30 5.00 6.00 9
Share price at year-end, SEK (B share) 77 89 41 63 69 108 140 136 151 213 186
Direct return, % (B share) 23.6 3.5 7.6 4.9 2.3 1.4 2.4 2.9 2.9 2.3 3.2
Effective return, % (B share) 344 19 (50) 61 13 60 32 0 30 46 (10)
Price/earnings ratio (B share) 46 7 neg 36 neg neg 4 7 6 9 9
EBIT-multiple 55 8 45 neg neg 36 7 7 16 9 11
Payout ratio, % 622 25 neg 176 neg neg 11 20 16 22 31
Shareholders' equity, SEK 786 97 91 87 77 70 98 110 125 137 154
Income as percentage of average
shareholders' equity 15.8 13.3 neg 2.0 neg neg 36.5 19.3 23.7 17.4 13.7
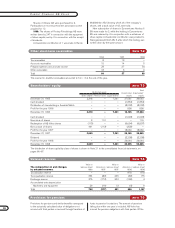
The largest shareholders in AB Volvo, December 31, 1998
Number of % of total Share of
shares votes capital %
The funds of FöreningsSparbanken 43,435,512 11.2 9.8
The National Pension Insurance Fund,
Fourth Fund managing board 22,047,590 8.6 5.0
Svenska Handelsbanken
(pension funds) 8,700,000 5.2 2.0
Försäkringsbolaget SPP
(pension funds) 16,985,672 4.8 3.8
AMF Pensionsförsäkring AB
(labour market insurances) 16,130,000 4.7 3.7
Skandia (insurance group) 12,722,804 4.7 2.9
Nordbankens aktiefonder
(saving funds) 10,760,625 3.6 2.4
Trygg-Hansa Försäkring
(insurance group) 7,074,343 2.9 1.6
SEB/Trygg/ABB aktiefonder
(saving funds) 6,674,230 2.9 1.5
Parcitas Investment SA 4,975,000 2.9 1.1
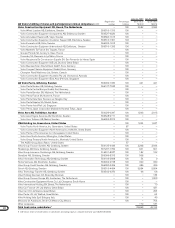
Exchange listings of Volvo shares, locations and year
Stockholm 1935
London 1972
Frankfurt am Main, Düsseldorf, Hamburg 1974
Paris 19841
United States (NASDAQ) 1985
Brussels, Antwerp 1985
Tokyo 1986
Zürich, Basel, Geneva 19871
1 The Board of Directors decided on delisting in February 1998.
1 Income per share is calculated as net income divided by average number of shares.
2 Dividend in SEK per share, divided by share price at year-end.
3 Share price at year-end, including dividend paid during the year, divided by share price
at beginning of year, including redemption 1997 and distribution of one share of
Swedish Match 1996.
4 Share price at year-end divided by income per share.
5 Market value at year-end plus net financial debt and minority interest, divided by op-
erating income, before items affecting comparability.
6 Dividend divided by income per share.
7 Shareholders’ equity divided by number of shares outstandning at year-end.
8 Plus one share of Swedish Match per Volvo share, price of SEK 21.74
(weighted average first ten trading days following listing).
9 Proposed by the Board of Directors.
10 Source: NASDAQ - Amex Online
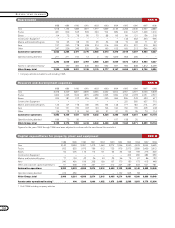
Distribution of shares, Dec 31, 1998
Volvo shareholders Number of Number Share of
owning shareholders % of shares capital, %
1– 500 shares 182,046 86.4 19,124,640 4.3
501– 1,000 shares 15,072 7.2 11,537,075 2.6
1,001– 2,000 shares 7,550 3.6 11,021,076 2.5
2,001– 5,000 shares 3,900 1.9 12,184,745 2.8
5,001– 10,000 shares 914 0.4 6,548,794 1.5
10,001– 20,000 shares 427 0.2 6,017,382 1.4
20,001– 50,000 shares 259 0.1 7,958,222 1.8
50,001–100,000 shares 146 0.1 10,538,236 2.4
100,001– shares 284 0.1 356,590,715 80.7
Total 210,598 100 441,520,885 100
Data per share (adjusted for issues and splits)
Other share data
Number of shareholders
at year-end 177,400 173,200 169,100 170,500 163,800 147,300 182.700 206,700 176,800 225,500 210,600
Number of Series A shares at
year-end, millions 25.3 25.3 25.3 25.3 25.3 25.3 142.2 142.2 142.2 138.6 138.6
Number of Series B shares at
year-end, millions 52.3 52.3 52.3 52.3 52.3 52.3 301.9 321.4 321.4 302.9 302.9
Number of Series A shares traded in
Stockholm during the year, millions 2.4 1.3 2.1 64.7 16.6 32.8 54.1 23.2 23.7 23.7 34.5
Number of Series B shares traded in
Stockholm during the year, millions 19.3 13.7 13.2 34.5 169.7 465.5 363.3 363.3 316.4 362.7 371.3
Number of A and B shares traded in
London during the year, millions 14.9 19.3 11.0 89.1 178.9 150.7 287.5 232.8 301.0 260.8 425.5
Number of shares traded in ADR,
NASDAQ during the year, millions 5.7 4.6 1.9 9.9 9.4 11.5 19.0 73.5 83.0 51.810 50.5 10