Volvo 1998 Annual Report Download - page 75
Download and view the complete annual report
Please find page 75 of the 1998 Volvo annual report below. You can navigate through the pages in the report by either clicking on the pages listed below, or by using the keyword search tool below to find specific information within the annual report.-
 1
1 -
2
-
3
-
4
-
5
-
6
-
7
-
8
-
9
-
10
-
11
-
12
-
13
-
14
-
15
-
16
-
17
-
18
-
19
-
20
-
21
-
22
-
23
-
24
-
25
-
26
-
27
-
28
-
29
-
30
-
31
-
32
-
33
-
34
-
35
-
36
-
37
-
38
-
39
-
40
-
41
-
42
-
43
-
44
-
45
-
46
-
47
-
48
-
49
-
50
-
51
-
52
-
53
-
54
-
55
-
56
-
57
-
58
-
59
-
60
-
61
-
62
-
63
-
64
-
 65
65 -
 66
66 -
 67
67 -
 68
68 -
 69
69 -
 70
70 -
 71
71 -
 72
72 -
 73
73 -
 74
74 -
 75
75 -
 76
76 -
 77
77 -
 78
78 -
 79
79 -
 80
80 -
 81
81 -
 82
82 -
 83
83 -
 84
84 -
 85
85 -
86
-
87
-
88
-
89
-
90
-
91
-
92
-
93
-
94
-
95
-
96
-
97
-
98
-
99
-
100
-
101
-
102
-
103
-
104
-
105
-
106
-
107
-
108
-
109
-
110
-
111
-
112
 |
 |
73
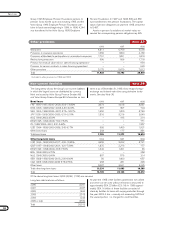
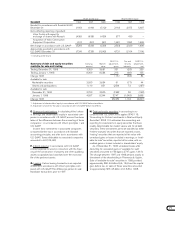
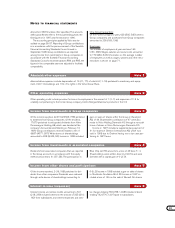
Total outstandning currency contracts
December 31 1996 December 31 1997 December 31 1998
Notional Carrying Estimated Notional Carrying Estimated Notional Carrying Estimated
amount amount fair value amount amount fair value amount amount fair value
Foreign exchange
contracts
– receivable
position 56,238 15 3,492 40,349 248 2,006 71,381 145 2,189
– payable position 50,303 (4) (1,477) 84,591 (447) (3,762) 93,215 (491) (3,524)
Foreign exchange swaps
– receivable
position 83,301 4 2,623 27,268 — 1,416 27,568 57 865
– payable position 81,565 (1) (2,517) 26,045 — (1,604) 32,491 (384) (880)
Options - purchased
– receivable
position 11,163 33 1,075 5,135 — 379 4,745 — 193
– payable position 34 — — 4,156 — (147) 324 — (5)
Options – written
– receivable
position — — — 2,080 — 57 2,867 — 38
– payable position 5,806 — (17) 4,274 — (61) 3,147 — (42)
Total 47 3,179 (199) (1,716) (673) (896)
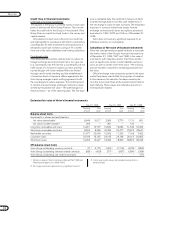
The notional amount of the derivative contracts represents the
gross contract amount outstanding. To determine the estimated
fair value, the major part of the outstanding contracts have been
marked-to-market. Discounted cash flows has been used in
some cases.
Interest-rate risks
Interest-rate risks relate to the risk that changes in interest-
rate levels affect the Group’s profit. By matching fixed-
interest periods of financial assets and liabilities, Volvo
reduces the effects of interest-rate changes. Interest-
rate swaps are used to shorten the interest-rate periods
of the Group’s long-term loans. Exchange-rate swaps
make it possible to borrow in foreign currencies in differ-
ent markets without incurring currency risk.
Volvo also holds standardized futures and forward rate
agreements. The majority of these contracts are used to
secure interest levels for short-term borrowing or placement.
Liquidity risks
Volvo ensures maintenance of a strong financial position
by continuously keeping a certain percentage of sales in
liquid assets. A proper balance between short- and long-
term borrowing, as well as the ability to borrow in the
form of credit facilities, are designed to ensure longer-
term financing.
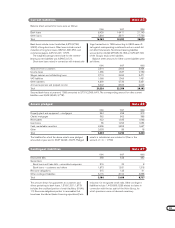
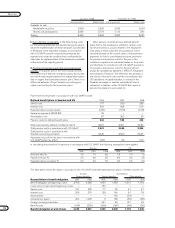
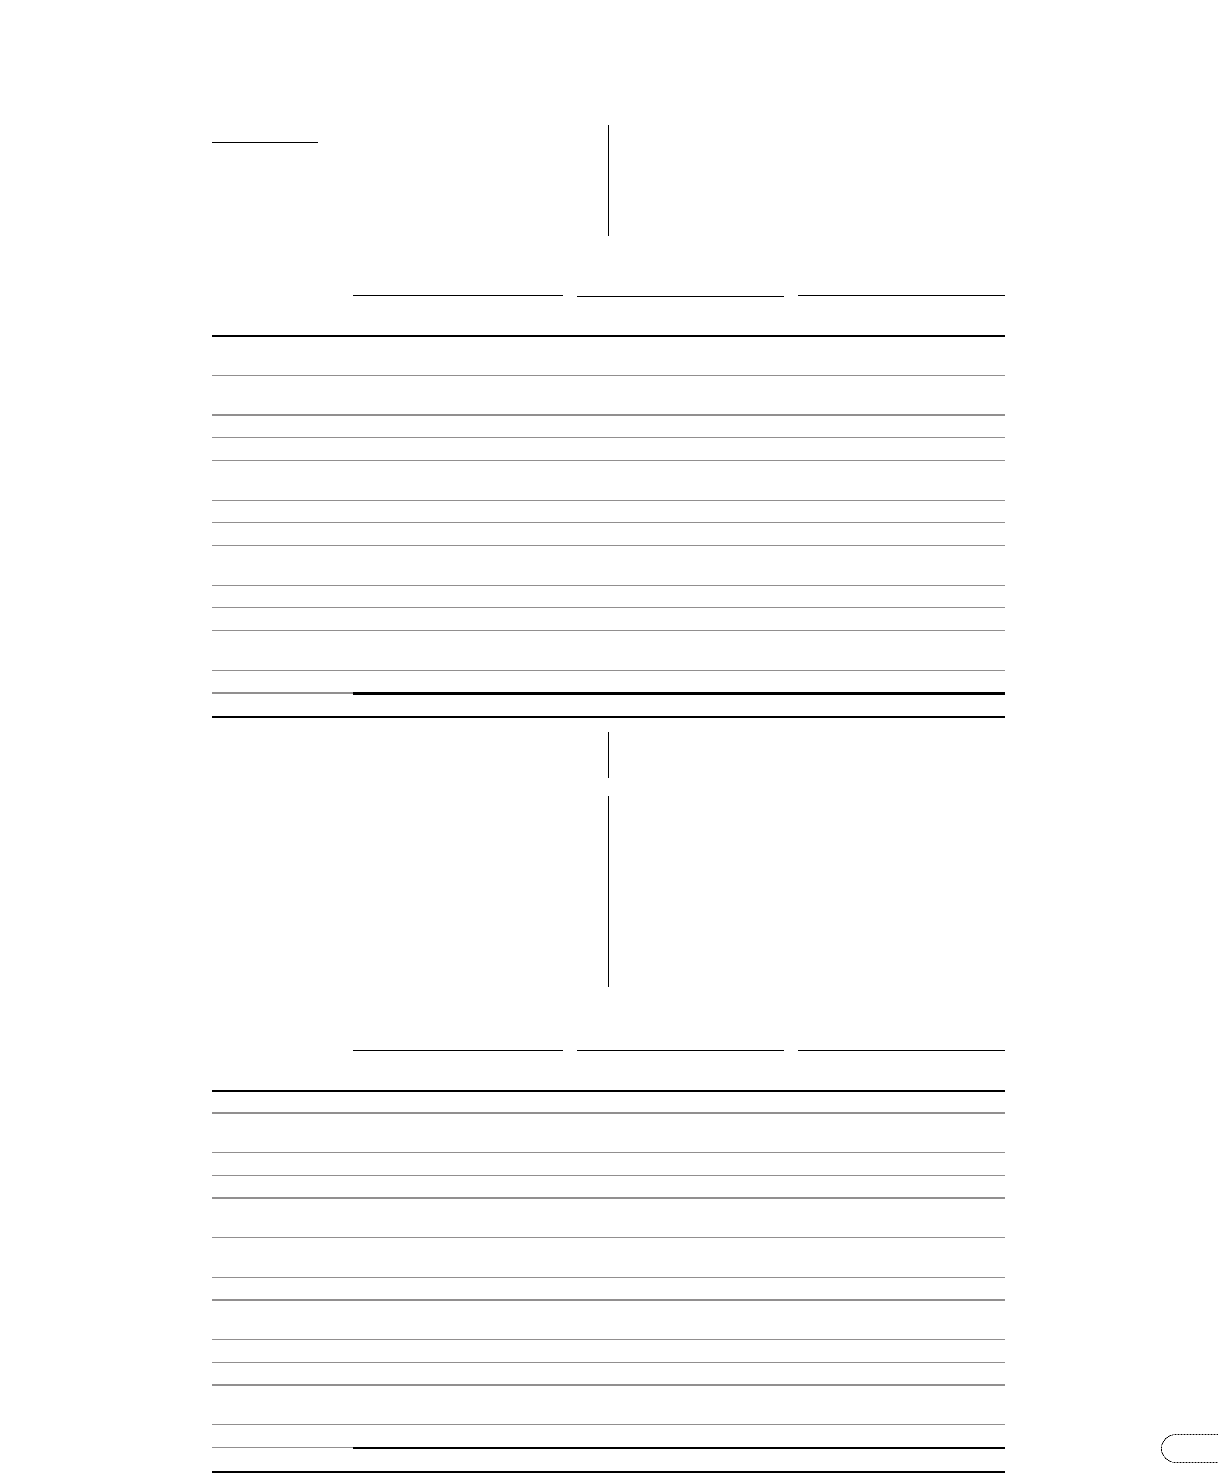
Volvo Group outstanding interest related contracts
December 31 1996 December 31 1997 December 31 1998
Notional Carrying Estimated Notional Carrying Estimated Notional Carrying Estimated
amount amount fair value amount amount fair value amount amount fair value
Interest-rate swaps
– receivable
position 10,349 — 335 20,322 9 875 14,705 10 497
– payable position 15,416 (34) (462) 28,142 (25) (1,760) 32,775 (240) (639)
Forwards and futures
– receivable
position 153,553 — 303 165,186 — 435 240,245 — 1,781
– payable
position 170,670 — (550) 190,866 (17) (465) 262,968 (54) (1,855)
Options purchased, caps and floors
– receivable
position 727 1 3 521 — 2 — — —
– payable position 8 (8) (8) 159 — — — — —
Options written, caps and floors
– receivable
position 300 — — — — — — — —
– payable position 88 (44) (44) 88 (44) (44) 420 (50) (50)
Total (85) (423) (77) (957) (334) (266)
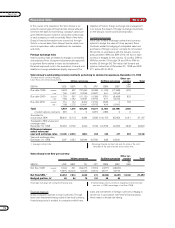
Equity exposure
In conjunction with translation of the Group’s assets and
liabilities in foreign subsidiaries to Swedish kronor, a risk
arises that the currency rate will have an effect on the
consolidated balance sheet. In accordance with the
Group’s currency policy, net investments (shareholders’
equity) in foreign subsidiaries and associated companies
are hedged up to 50%. Hedging is mainly done through
borrowing in the same currency as the net investments.
At year-end 1998, net assets in subsidiaries and as-
sociated companies outside Sweden amounted SEK
28 billion, of which 12% was hedged.