Volvo 1998 Annual Report Download - page 77
Download and view the complete annual report
Please find page 77 of the 1998 Volvo annual report below. You can navigate through the pages in the report by either clicking on the pages listed below, or by using the keyword search tool below to find specific information within the annual report.-
 1
1 -
2
-
3
-
4
-
5
-
6
-
7
-
8
-
9
-
10
-
11
-
12
-
13
-
14
-
15
-
16
-
17
-
18
-
19
-
20
-
21
-
22
-
23
-
24
-
25
-
26
-
27
-
28
-
29
-
30
-
31
-
32
-
33
-
34
-
35
-
36
-
37
-
38
-
39
-
40
-
41
-
42
-
43
-
44
-
45
-
46
-
47
-
48
-
49
-
50
-
51
-
52
-
53
-
54
-
55
-
56
-
57
-
58
-
59
-
60
-
61
-
62
-
63
-
64
-
65
-
66
-
 67
67 -
 68
68 -
 69
69 -
 70
70 -
 71
71 -
 72
72 -
 73
73 -
 74
74 -
 75
75 -
 76
76 -
 77
77 -
 78
78 -
 79
79 -
 80
80 -
 81
81 -
 82
82 -
 83
83 -
 84
84 -
 85
85 -
 86
86 -
 87
87 -
88
-
89
-
90
-
91
-
92
-
93
-
94
-
95
-
96
-
97
-
98
-
99
-
100
-
101
-
102
-
103
-
104
-
105
-
106
-
107
-
108
-
109
-
110
-
111
-
112
 |
 |

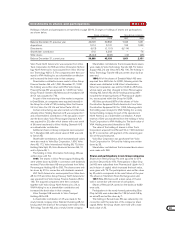
75
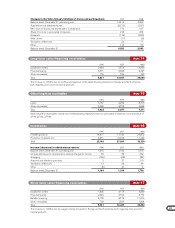
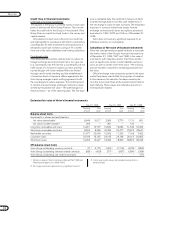
A summary of the Volvo Group’s approximate profit for the year and shareholders’ equity determined in accordance
with U.S. GAAP, is presented in the accompanying tables.
Application of U.S. GAAP would have the following approximate effect on consolidated profit for the year and share-
holders’ equity:
Profit for the year 1996 1997 1998
Profit for the year in accordance with Swedish accounting principles 12,477 10,359 8,638
Items increasing (decreasing) reported profit for the year
Foreign currency translation (A) (89) (4,994) 535
Income taxes (B) 494 122 (201)
Tooling costs (C) (312) — —
Business combinations (D) (529) (529) (530)
Shares and participations (E) 176 — 90
Interest costs (F) 15 28 20
Leasing (G) 49 46 (118)
Debt and equity securities (H) (147) 123 116
Items affecting comparability (I) — — 1,178
Pensions and other post-employment benefits (J) (95) 65 313
Tax effect of above U.S. GAAP adjustments 178 1,336 (609)
Net increase (decrease) in profit for the year (260) (3,803) 794
Approximate profit for the year
in accordance with U.S. GAAP 12,217 6,556 9,432
Approximate profit for the year per share,
SEK in accordance with U.S. GAAP 26.40 14.50 21.40
Weight average number of shares outstanding (in thousands) 463,558 452,540 441,521
Shareholders’ equity 1996 1997 1998
Shareholders’ equity in accordance with
Swedish accounting principles 57,876 60,431 68,056
Items increasing (decreasing) reported shareholders’ equity
Foreign currency translation (A) 3,660 (1,163) (628)
Income taxes (B) 1,398 1,520 1,319
Tooling costs (C) — — —
Business combinations (D) 2,558 2,029 1,499
Shares and participations (E) (90) (90) —
Interest costs (F) 503 531 551
Leasing (G) (91) (51) (177)
Debt and equity securities (H) 1,604 3,962 133
Items affecting comparability (I) — — 1,178
Pensions and other post-employment benefits (J) 786 851 1,548
Other (203) (224) (226)
Tax effect of above U.S. GAAP adjustments (1,726) (1,184) (774)
Net increase in shareholders’ equity 8,399 6,181 4,423
Approximate shareholders’ equity
in accordance with U.S. GAAP 66,275 66,612 72,479
Profit for the year and Shareholders’ equity in accordance with U.S. GAAP Note 31