Volvo 1998 Annual Report Download - page 71
Download and view the complete annual report
Please find page 71 of the 1998 Volvo annual report below. You can navigate through the pages in the report by either clicking on the pages listed below, or by using the keyword search tool below to find specific information within the annual report.-
 1
1 -
2
-
3
-
4
-
5
-
6
-
7
-
8
-
9
-
10
-
11
-
12
-
13
-
14
-
15
-
16
-
17
-
18
-
19
-
20
-
21
-
22
-
23
-
24
-
25
-
26
-
27
-
28
-
29
-
30
-
31
-
32
-
33
-
34
-
35
-
36
-
37
-
38
-
39
-
40
-
41
-
42
-
43
-
44
-
45
-
46
-
47
-
48
-
49
-
50
-
51
-
52
-
53
-
54
-
55
-
56
-
57
-
58
-
59
-
60
-
 61
61 -
 62
62 -
 63
63 -
 64
64 -
 65
65 -
 66
66 -
 67
67 -
 68
68 -
 69
69 -
 70
70 -
 71
71 -
 72
72 -
 73
73 -
 74
74 -
 75
75 -
 76
76 -
 77
77 -
 78
78 -
 79
79 -
 80
80 -
 81
81 -
82
-
83
-
84
-
85
-
86
-
87
-
88
-
89
-
90
-
91
-
92
-
93
-
94
-
95
-
96
-
97
-
98
-
99
-
100
-
101
-
102
-
103
-
104
-
105
-
106
-
107
-
108
-
109
-
110
-
111
-
112
 |
 |

69
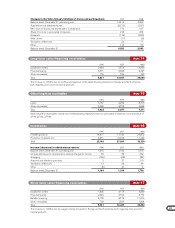
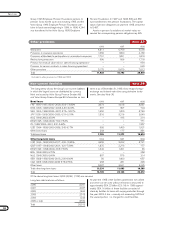
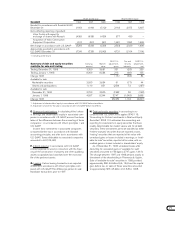
Balance sheet amounts for loans were as follows:
1996 1997 1998
Bank loans 8,429 14,411 21,143
Other loans 5,834 3,871 17,733
Total 14,263 18,282 38,876
Bank loans include current maturities, 4,379 (2,748;
2,082), of long-term loans. Other loans include current
maturities of long-term loans, 3,825 (1,498; 651), and
commercial papers, 9,472 (1,291; 1,757).
The weighted average interest rate for the interest-
bearing current liabilities was 6.5% (5.0; 5.1).
Short-term loans raised in connection with interest arbi-
trage transactions in 1996 amounting to 2,893 were off-
set against corresponding investments and as a result did
not affect total assets. Noninterest-bearing liabilities
accounted for 42,499 (37,595; 32,189), or 52% (67; 69)
of the Group’s total current liabilities.
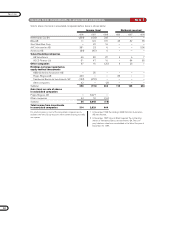
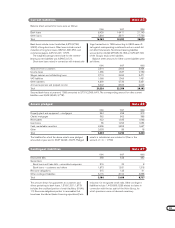
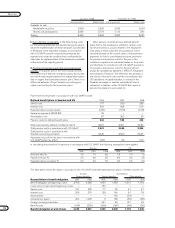
Balance sheet amounts for Other current liabilities were
as follows:
1996 1997 1998
Advances from customers 2,514 2,603 3,464
Income taxes 1,436 1,637 2,739
Wages, salaries and withholding taxes 3,710 3,690 3,471
VAT liabilities 1,068 1,366 1,431
Other liabilities 4,899 4,736 5,451
Accrued expenses and prepaid income 6,602 8,306 9,626
Total 20,229 22,338 26,182
Secured bank loans at year-end 1998 amounted to 3,731 (2,369; 641). The corresponding amount for other current
liabilities was 3,048 (4,563; 2,778).
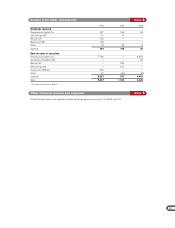
1996 1997 1998
Property, plant and equipment – mortgages 544 298 313
Chattel mortgages 362 862 388
Receivables 922 1,335 1,948
Inventories 36 1,266 1,054
Cash, marketable securities 2,636 2,893 1,667
Other 2,003 89 18
Total 6,503 6,743 5,388
The liabilities for which the above assets were pledged
amounted at year-end to 6,567 (9,924; 4,527). Pledged
assets in subsidiaries are included in Other in the
amount of — (— ; 1,750).
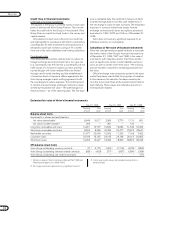
1996 1997 1998
Discounted bills 368 628 482
Guarantees:
Bank loans and trade bills – associated companies 316 22 8
Bank loans – customers and others 1,873 1,531 1,318
Recourse obligations 515 123 91
Other contingent liabilities 3,116 3,102 4,838
Total 6,188 5,406 6,737
The amount shown for guarantees to customers and
others pertaining to bank loans, 1,318 (1,531; 1,873)
includes the unutilized portion of credit facilities, 50 (46;
11). Recourse obligations pertain to receivables that
have been transferred (sales-financing operations), less
reduction for recognized credit risks. Other contingent
liabilities include 1,442 (699; 528) related to claims in
connection with the tax audit of the Volvo Group, for
which provisions were not deemed necessary.
Current liabilities Note 25
Assets pledged Note 26
Contingent liabilities Note 27