Volvo 1998 Annual Report Download - page 3
Download and view the complete annual report
Please find page 3 of the 1998 Volvo annual report below. You can navigate through the pages in the report by either clicking on the pages listed below, or by using the keyword search tool below to find specific information within the annual report.-
 1
1 -
 2
2 -
 3
3 -
 4
4 -
 5
5 -
 6
6 -
 7
7 -
 8
8 -
 9
9 -
 10
10 -
 11
11 -
 12
12 -
 13
13 -
 14
14 -
15
-
16
-
17
-
18
-
19
-
20
-
21
-
22
-
23
-
24
-
25
-
26
-
27
-
28
-
29
-
30
-
31
-
32
-
33
-
34
-
35
-
36
-
37
-
38
-
39
-
40
-
41
-
42
-
43
-
44
-
45
-
46
-
47
-
48
-
49
-
50
-
51
-
52
-
53
-
54
-
55
-
56
-
57
-
58
-
59
-
60
-
61
-
62
-
63
-
64
-
65
-
66
-
67
-
68
-
69
-
70
-
71
-
72
-
73
-
74
-
75
-
76
-
77
-
78
-
79
-
80
-
81
-
82
-
83
-
84
-
85
-
86
-
87
-
88
-
89
-
90
-
91
-
92
-
93
-
94
-
95
-
96
-
97
-
98
-
99
-
100
-
101
-
102
-
103
-
104
-
105
-
106
-
107
-
108
-
109
-
110
-
111
-
112
 |
 |

1
4 Comments by the
Chief Executive Officer
6 Board of Directors’ Report
26 Financial review by business area
38 Sales financing
40 Personnel
42 Product Renewal
52 Consolidated income statements
53 Consolidated balance sheets
54 Cash flow analysis
55 Notes to the Consolidated
Financial Statements
80 Parent Company AB Volvo
92 Proposed disposition of
unappropriated earnings
93 Auditors’ report for AB Volvo
94 Shareholder information
96 Board of Directors and Auditors
98 Group Executive Committee
99 Eleven-year summary
108 Addresses
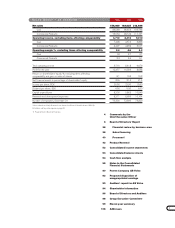
VOLVO GROUP – AN OVERVIEW 1996 1997 1998
Net sales 156,060 183,625 212,936
Cars 83,589 96,453 103,798
Commercial Products 73,634 90,122 111,107
Operating income, excluding items affecting comparability 3,710 8,418 9,010
Cars 1,498 4,510 3,808
Commercial Products 2,497 4,459 5,617
Operating margin %, excluding items affecting comparability 2.4 4.6 4.2
Cars 1.8 4.7 3.7
Commercial Products 3.4 4.9 5.1
Total operating income 3,710 8,418 6,679
Profit for the year 12,477 10,359 8,638
Return on shareholders’ equity, %, excluding items affecting
comparability and gain on sales of shares 8.1 10.4 10.3
Net financial assets in percentage of shareholders’ equity 20.6 31.2 21.5
Income per share, SEK 26.90 22.90 19.60
Dividend per share, SEK 4.30 5.00 6.00 1)
Capital expenditures 8,200 9,863 10,549
Research and development expenses 8,271 8,659 10,104
Number of employees, December 31 70,330 72,900 79,820
Unless otherwise stated, all amounts are shown in millions of Swedish kronor (SEK M).
Definitions and key ratios appear on page 57.
1) Proposed by the Board of Directors.