Volvo 1998 Annual Report Download - page 83
Download and view the complete annual report
Please find page 83 of the 1998 Volvo annual report below. You can navigate through the pages in the report by either clicking on the pages listed below, or by using the keyword search tool below to find specific information within the annual report.-
 1
1 -
2
-
3
-
4
-
5
-
6
-
7
-
8
-
9
-
10
-
11
-
12
-
13
-
14
-
15
-
16
-
17
-
18
-
19
-
20
-
21
-
22
-
23
-
24
-
25
-
26
-
27
-
28
-
29
-
30
-
31
-
32
-
33
-
34
-
35
-
36
-
37
-
38
-
39
-
40
-
41
-
42
-
43
-
44
-
45
-
46
-
47
-
48
-
49
-
50
-
51
-
52
-
53
-
54
-
55
-
56
-
57
-
58
-
59
-
60
-
61
-
62
-
63
-
64
-
65
-
66
-
67
-
68
-
69
-
70
-
71
-
72
-
 73
73 -
 74
74 -
 75
75 -
 76
76 -
 77
77 -
 78
78 -
 79
79 -
 80
80 -
 81
81 -
 82
82 -
 83
83 -
 84
84 -
 85
85 -
 86
86 -
 87
87 -
 88
88 -
 89
89 -
 90
90 -
 91
91 -
 92
92 -
 93
93 -
94
-
95
-
96
-
97
-
98
-
99
-
100
-
101
-
102
-
103
-
104
-
105
-
106
-
107
-
108
-
109
-
110
-
111
-
112
 |
 |

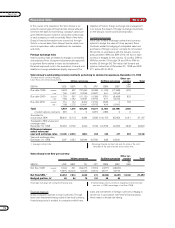
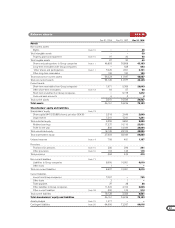
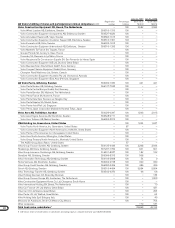
81
Dec 31, 1996 Dec 31, 1997 Dec 31, 1998
Assets
Non-current assets
Rights Note 10 ––39
Total intangible assets – – 39
Property, plant and equipment Note 10 97 30 40
Total tangible assets 97 30 40
Shares and participations in Group companies Note 11 46,893 39,868 45,193
Long-term receivables with Group companies — 628 643
Other shares and participations Note 11 7,025 1,051 2,131
Other long-term receivables 105 100 100
Total financial non-current assets 54,023 41,647 48,067
Total non-current assets 54,120 41,677 48,146
Current assets
Short-term receivables from Group companies 1,971 5,309 29,043
Other short-term receivables Note 12 64 57 68
Short-term investments in Group companies — 5,178 1,872
Cash and bank accounts 6 5 4
Total current assets 2,041 10,549 30,987
Total assets 56,161 52,226 79,133
Shareholders’ equity and liabilities
Shareholders’ equity Note 13
Share capital (441,520,885 shares, par value SEK 6) 2,318 2,649 2,649
Legal reserve 7,241 7,241 7,241
Total restricted equity 9,559 9,890 9,890
Retained earnings 17,227 10,110 25,951
Profit for the year 898 18,049 24,044
Total unrestricted equity 18,125 28,159 49,995
Total shareholders’ equity 27,684 38,049 59,885
Untaxed reserves Note 14 758 481 1,167
Provisions
Provisions for pensions Note 15 280 296 291
Other provisions Note 16 104 126 119
Total provisions 384 422 410
Non-current liabilities Note 17
Liabilities to Group companies 8,606 10,951 9,010
Other loans 1 — —
Total non-current liabilities 8,607 10,951 9,010
Current liabilities
Loans from Group companies 7,067 — 765
Other loans 2 1 —
Trade payables 37 38 36
Other liabilities to Group companies 11,322 2,162 6,946
Other current liabilities Note 18 300 122 914
Total current liabilities 18,728 2,323 8,661
Total shareholders’ equity and liabilities 56,161 52,226 79,133
Assets pledged Note 19 1,217 — —
Contingent liabilities Note 20 64,650 72,287 80,018
Balance sheets SEK M