Volvo 1998 Annual Report Download - page 59
Download and view the complete annual report
Please find page 59 of the 1998 Volvo annual report below. You can navigate through the pages in the report by either clicking on the pages listed below, or by using the keyword search tool below to find specific information within the annual report.-
 1
1 -
2
-
3
-
4
-
5
-
6
-
7
-
8
-
9
-
10
-
11
-
12
-
13
-
14
-
15
-
16
-
17
-
18
-
19
-
20
-
21
-
22
-
23
-
24
-
25
-
26
-
27
-
28
-
29
-
30
-
31
-
32
-
33
-
34
-
35
-
36
-
37
-
38
-
39
-
40
-
41
-
42
-
43
-
44
-
45
-
46
-
47
-
48
-
 49
49 -
 50
50 -
 51
51 -
 52
52 -
 53
53 -
 54
54 -
 55
55 -
 56
56 -
 57
57 -
 58
58 -
 59
59 -
 60
60 -
 61
61 -
 62
62 -
 63
63 -
 64
64 -
 65
65 -
 66
66 -
 67
67 -
 68
68 -
 69
69 -
70
-
71
-
72
-
73
-
74
-
75
-
76
-
77
-
78
-
79
-
80
-
81
-
82
-
83
-
84
-
85
-
86
-
87
-
88
-
89
-
90
-
91
-
92
-
93
-
94
-
95
-
96
-
97
-
98
-
99
-
100
-
101
-
102
-
103
-
104
-
105
-
106
-
107
-
108
-
109
-
110
-
111
-
112
 |
 |

57
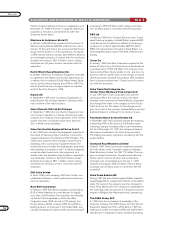
of the development costs incurred before Volvo Aero
entered the project. These costs are capitalized and
depreciated over 5 to 10 years.
The difference between depreciation noted above and
depreciation allowable for tax purposes is reported by
the parent company and in the individual Group com-
panies as accumulated extra depreciation, which is in-
cluded in untaxed reserves. Consolidated reporting of
these items is described below under the heading
Deferred tax, allocations and untaxed reserves.
Goodwill is included in intangible assets and amor-
tized on a straight-line basis over 5 to 20 years. The
goodwill items pertaining to Volvo Construction
Equipment, Champion Road Machinery, The AGES
Group, Prévost, Nova BUS, MASA and Volvo Construction
Equipment, Korea are being amortized over 20 years due
to the holdings’ long-term and strategic importance.
Inventories
Inventories are posted at the lower of cost, in accordance
with the first-in, first-out method (FIFO), or net realizable
value. Adequate provision has been made for obsolescence.
Marketable securities
Marketable securities are valued at the lower of cost or
market value in accordance with the portfolio method.
Research and development expenses
and warranty expenses
Research and development expenses are charged to
income as incurred.
Estimated costs for product warranties are charged
to cost of sales when the products are sold.
Items affecting comparability
Items affecting comparability are reported separately in
the income statement. They pertain to restructuring costs
and income and expenses mainly attributable to changes
in the composition of the Group.
Application of estimated values
In preparing the year-end financial statements in accord-
ance with generally accepted accounting principles,
company management makes certain estimates and
assumptions which affect the value of assets and liabilities
as well as contingent liabilities at the closing date.
Reported amounts for income and expenses in the
reporting period are also affected. The actual result may
differ from these estimates.
Deferred tax, allocations, untaxed reserves
Tax legislation in Sweden and other countries sometimes
contains rules other than those identified with generally
accepted accounting principles, and which pertain to the
timing of taxation and measurement of certain commer-
cial transactions. Deferred tax is shown on differences
which arise between the taxable value and reported
value of assets and liabilities – so-called temporary dif-
ferences – as well as on tax loss carryforwards. However,
as regards the valuation of deferred tax receivables – the
value of future tax reductions – deferred tax receivables
in excess of deferred tax liabilities in the same tax area
are not reported. See information on page 55 pertaining
to future changes in accounting principles.
Tax laws in Sweden and certain other countries allow
companies to defer payment of taxes through allocations
to untaxed reserves. These items are treated as tempo-
rary differences in the consolidated balance sheet, that
is, a division is made between deferred tax liability and
equity capital (restricted reserves). In the consolidated
income statement an allocation to, or withdrawal from,
untaxed reserves is divided between deferred tax and
net income for the year.
The individual Group companies (including AB Volvo)
report untaxed reserves as a separate balance sheet
item. In the income statements, allocations to and with-
drawals from untaxed reserves are reported under the
heading Allocations. The reported tax expense is based
on tax on income after allocations.
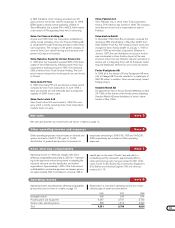
Definition of keys ratios
Operating margin
Operating income divided by net sales.
Return on operating capital
Operating income divided by average operating capital.
Operating capital consists of operating assets (tangible
and intangible assets, receivables and inventories) re-
duced by noninterest-bearing current liabilities. This ratio
is used only for Volvo’s business areas, not for the Group
as a whole.
Return on shareholders’ equity
Profit for the year divided by average shareholders’ equity.
Interest coverage
Income divided by interest expense and similar charges.
Income includes operating income, income from invest-
ments in associated companies, income from other
investments and interest income and similar credits.
Self-financing ratio
Cash flow from year’s operations (see Cash flow analysis)
divided by net investments in property, plant and equip-
ment and leasing assets.
Net financial assets (net debt)
Cash and bank accounts, marketable securities and
interest-bearing short- and long-term receivables re-
duced by short- and long-term interest-bearing liabilities.
Net debt in Volvo’s sales-financing companies is not
included since the interest expense on these liabilities
is charged against operating income and does not affect
consolidated net interest expense.
Income per share
Profit for the year divided by the weighted average
number of shares outstanding during the period.
Average number of shares
The weighted average number of shares for a given year
is calculated as follows: the eight opening and closing
figures for the four quarters of the year are totaled and
then divided by eight.