Volvo 1998 Annual Report Download - page 15
Download and view the complete annual report
Please find page 15 of the 1998 Volvo annual report below. You can navigate through the pages in the report by either clicking on the pages listed below, or by using the keyword search tool below to find specific information within the annual report.-
 1
1 -
2
-
3
-
4
-
 5
5 -
 6
6 -
 7
7 -
 8
8 -
 9
9 -
 10
10 -
 11
11 -
 12
12 -
 13
13 -
 14
14 -
 15
15 -
 16
16 -
 17
17 -
 18
18 -
 19
19 -
 20
20 -
 21
21 -
 22
22 -
 23
23 -
 24
24 -
 25
25 -
26
-
27
-
28
-
29
-
30
-
31
-
32
-
33
-
34
-
35
-
36
-
37
-
38
-
39
-
40
-
41
-
42
-
43
-
44
-
45
-
46
-
47
-
48
-
49
-
50
-
51
-
52
-
53
-
54
-
55
-
56
-
57
-
58
-
59
-
60
-
61
-
62
-
63
-
64
-
65
-
66
-
67
-
68
-
69
-
70
-
71
-
72
-
73
-
74
-
75
-
76
-
77
-
78
-
79
-
80
-
81
-
82
-
83
-
84
-
85
-
86
-
87
-
88
-
89
-
90
-
91
-
92
-
93
-
94
-
95
-
96
-
97
-
98
-
99
-
100
-
101
-
102
-
103
-
104
-
105
-
106
-
107
-
108
-
109
-
110
-
111
-
112
 |
 |

13
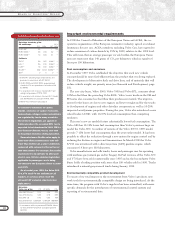
Operating income
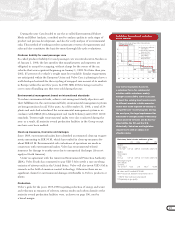
Group operating income amounted to SEK 6.7 billion (8.4), after SEK 2.3 billion
of items affecting comparability.
Excluding items affecting comparability, operating income increased by
SEK 0.6 billion, to SEK 9.0 billion.
Operating income of commercial products in total developed well, rising SEK
1.2 billion to SEK 5.6 billion. Higher volumes, favorable price trends for Trucks
in North America and costs savings in production were the main reasons for the
earnings improvement. This was partially offset by higher administration costs,
investments in product development and launches of new products.
Operating income of Cars, excluding items affecting comparability, declined
to SEK 3.8 billion (4.5). Higher volumes and cost-reduction measures in produc-
tion and purchasing could not offset the adverse effects of the weakening
demand in Southeast Asia, higher product development costs, increased price
pressures and the costs of production start-up and introduction of the Volvo S80.
The Group’s operating margin, which declined during the year, amounted to
3.1% (4.6). Excluding items affecting comparability, the operating margin was
4.2%.
Excluding items affecting comparability, the operating margin declined in all
business areas except Trucks. Volvo’s objective, to have an operating margin
exceeding 5%, was achieved by Construction Equipment and Aero.
Distributed by Cars and commercial products, operating margin was 3.7% and
5.1%, respectively.
Volvo Group consolidated
income statements, SEK billion 1996 1997 1998
Net sales 156.1 183.6 212.9
Cost of sales (121.3) (139.0) (163.9)
Gross income 34.8 44.6 49.0
Research and development expenses (8.3) (8.7) (10.1)
Selling expenses (14.9) (17.2) (19.0)
Administrative expenses (6.7) (7.0) (8.1)
Other operating income and expenses (1.2) (3.3) (2.8)
Items affecting comparability — — (2.3)
Operating income 3.7 8.4 6.7
Income from investments in associated companies 0.3 2.9 0.4
Income from other investments 9.0 1.2 4.5
Interest income and similar credits 4.8 3.5 1.5
Interest expenses and similar charges (3.2) (2.7) (1.4)
Other financial income and expenses (0.4) (0.1) (0.1)
Income after financial items 14.2 13.2 11.6
Taxes (1.8) (2.7) (2.9)
Minority interests 0.1 (0.1) (0.1)
Profit for the year 12.5 10.4 8.6
Income per share, SEK 26.90 22.90 19.60
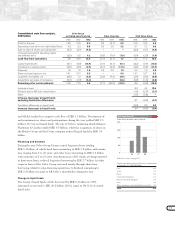
1996 1997 1998
Cars 1.5 4.5 3.8
Commercial
Products 2.6 4.5 5.6
Trucks 0.9 1.8 3.1
Buses 0.3 0.6 0.4
Construction Equipment 1.2 1.4 1.5
Marine and
Industrial Engines (0.0) 0.2 0.1
Aero 0.2 0.5 0.5
Other companies
and eliminations (0.4) (0.6) (0.4)
Operating income
excluding items
affecting comparability 3.7 8.4 9.0
Items affecting comparability – – (2.3)
Operating income 3.7 8.4 6.7
Other
Com- and
mercial elimi-
Cars Products nations Total
Operating income 1997 4.5 4.5 (0.6) 8.4
Increased volumes 0.5 1.5 2.0
Change in product
and market mix etc 0.6 2.4 3.0
Higher research and
development expenses (0.8) (0.6) (1.4)
Higher selling and
administrative expenses (0.6) (2.0) (2.6)
Conversion costs for
production of Volvo S80 (0.8) – (0.8)
Other 0.4 (0.2) 0.2 0.4
Operating income,
excluding items affect-
ing comparability 3.8 5.6 (0.4) 9.0
Items affecting
comparability (0.7) (1.5) (0.1) (2.3)
Operating income 1998 3.1 4.1 (0.5) 6.7
Operating income by business area
Change of operating income SEK billion
SEK billion