Volvo 1998 Annual Report Download - page 40
Download and view the complete annual report
Please find page 40 of the 1998 Volvo annual report below. You can navigate through the pages in the report by either clicking on the pages listed below, or by using the keyword search tool below to find specific information within the annual report.-
 1
1 -
2
-
3
-
4
-
5
-
6
-
7
-
8
-
9
-
10
-
11
-
12
-
13
-
14
-
15
-
16
-
17
-
18
-
19
-
20
-
21
-
22
-
23
-
24
-
25
-
26
-
27
-
28
-
29
-
 30
30 -
 31
31 -
 32
32 -
 33
33 -
 34
34 -
 35
35 -
 36
36 -
 37
37 -
 38
38 -
 39
39 -
 40
40 -
 41
41 -
 42
42 -
 43
43 -
 44
44 -
 45
45 -
 46
46 -
 47
47 -
 48
48 -
 49
49 -
 50
50 -
51
-
52
-
53
-
54
-
55
-
56
-
57
-
58
-
59
-
60
-
61
-
62
-
63
-
64
-
65
-
66
-
67
-
68
-
69
-
70
-
71
-
72
-
73
-
74
-
75
-
76
-
77
-
78
-
79
-
80
-
81
-
82
-
83
-
84
-
85
-
86
-
87
-
88
-
89
-
90
-
91
-
92
-
93
-
94
-
95
-
96
-
97
-
98
-
99
-
100
-
101
-
102
-
103
-
104
-
105
-
106
-
107
-
108
-
109
-
110
-
111
-
112
 |
 |

Sales financing
Expansion of its sales-financing operations is an important part of Volvo’s
strategy for greater growth and for strengthening Group profitability. The op-
erations play an important role in meeting the market’s growing need for in-
creasingly complex financial solutions, individually or in combination with
insurance and/or service contracts. It also strengthens the competitiveness of
Volvo’s dealers.
The operations are conducted in two distinct areas: Car Sales financing and
commercial products Sales financing. However, these operations constitute an
integral part of each business area’s total responsibilities. The sales-financing
operations comprise 32 (27) finance companies and an insurance company,
which are consolidated in the above structures, as well as 4 (4) associated
companies that are consolidated in accordance with the equity method. The
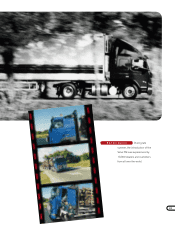
sales financing of commercial products pertains mainly to trucks, but also – to
an increasing degree – to buses and construction equipment.
The supply covers financing services in the form of installment contracts,
financial leasing, operational leasing and dealer financing. Insurance, service
and maintenance contracts are also offered in most markets, separately or in
combination with financing services. With the acquisition in 1998 of BRS Truck
Rental and Hire, Volvo has significantly strengthened its operations for short-
term leasing of commercial vehicles in the British market.
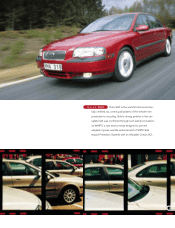
Sales-financing activities involving both passenger cars and commercial
products continued to expand strongly during 1998. The growth in the credit
portfolio was attributable to operations in North America, Great Britain and
Germany. During the year, a decision regarding establishment of a new finance
company for commercial products in Mexico was made. A new branch of Volvo-
owned Amazon Insurance was started up in France for Volvo Cars.
At year-end the credit portfolio amounted to SEK 67 billion (44), of which
52% (47) pertained to Cars and the remaining 48% (53) to commercial products.
The portfolio consisted of a total of 251,000 contracts (161,000), of which
169,000 (99,000) were for Cars and 82,000 (62,000) were for commercial
products. The market penetration, the number of sales finance and service
contracts relative to total new sales of cars and commercial products, varied
sharply from market to market and from one product to another but was, on
average, 31% (26) in 1998.
The financing of sales-financing operations is coordinated by Volvo Group
Finance, Volvo’s internal bank, in accordance with established policies.
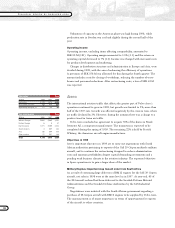
38
REDOVISNING PER AFFÄRSOMRÅDE
Operating income SEK M
Assets SEK M
Credit portfolio, net SEK M
Return on shareholders’ equity %
Market penetration %
Distribution of credit portfolio, net %
1997 1998
Cars 89 272
Commercial Products 113 198
Total 202 470
1997 1998
Cars 7.5 7.4
Commercial Products neg 2.6
Total neg 5.3
For companies established for more than four years,
return on shareholders’ equity for Cars was 11.3%
(13.2) and for Commercial Products 13.8% (14.5).
1997 1998
Cars 20,610 34,593
Commercial Products 23,374 31,968
Total 43,984 66,561
1997 1998
Cars 22,396 38,086
Commercial Products 24,529 33,916
Total 46,925 72,002
Regarding new sales
1997 1998
Cars 25 32
Commercial Products 30 27
Total 26 31
1997 1998
Cars
Operational leasing 31 35
Financial leasing 12 11
Installment contracts 27 33
Dealer financing 25 19
Other customer credits 5 2
Commercial Products
Operational leasing 25 26
Financial leasing 30 31
Installment contracts 26 26
Dealer financing 16 16
Other customer credits 3 1
SALES FINANCING