Volvo 1998 Annual Report Download - page 14
Download and view the complete annual report
Please find page 14 of the 1998 Volvo annual report below. You can navigate through the pages in the report by either clicking on the pages listed below, or by using the keyword search tool below to find specific information within the annual report.-
 1
1 -
2
-
3
-
 4
4 -
 5
5 -
 6
6 -
 7
7 -
 8
8 -
 9
9 -
 10
10 -
 11
11 -
 12
12 -
 13
13 -
 14
14 -
 15
15 -
 16
16 -
 17
17 -
 18
18 -
 19
19 -
 20
20 -
 21
21 -
 22
22 -
 23
23 -
 24
24 -
25
-
26
-
27
-
28
-
29
-
30
-
31
-
32
-
33
-
34
-
35
-
36
-
37
-
38
-
39
-
40
-
41
-
42
-
43
-
44
-
45
-
46
-
47
-
48
-
49
-
50
-
51
-
52
-
53
-
54
-
55
-
56
-
57
-
58
-
59
-
60
-
61
-
62
-
63
-
64
-
65
-
66
-
67
-
68
-
69
-
70
-
71
-
72
-
73
-
74
-
75
-
76
-
77
-
78
-
79
-
80
-
81
-
82
-
83
-
84
-
85
-
86
-
87
-
88
-
89
-
90
-
91
-
92
-
93
-
94
-
95
-
96
-
97
-
98
-
99
-
100
-
101
-
102
-
103
-
104
-
105
-
106
-
107
-
108
-
109
-
110
-
111
-
112
 |
 |

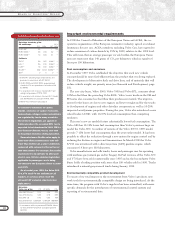
Number of vehicles invoiced
12
plant in Born, the Netherlands, during the first quarter of 1999. Thereafter the
plant will be owned equally by Volvo Cars and Mitsubishi.
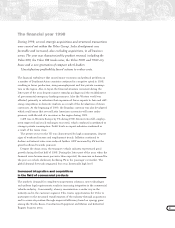
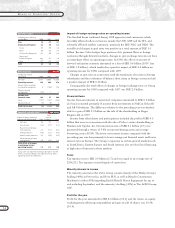
Income and financial position
Net sales
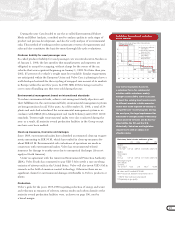
Net sales of the Volvo Group for the full year 1998 amounted to SEK 212.9
billion, compared with sales of SEK 183.6 billion for the preceding year, an
increase of 13%, excluding divested and acquired companies. Adjusted also for
changes in foreign exchange rates, the increase was 11%. Sales development per
market area was characterized by great geographical differences, ranging from
strong demand in North America and Europe to very weak demand in Southeast
Asia and a leveling off in South America. Excluding divested and acquired units,
net sales increased in all Volvo’s business areas, compared with the preceding
year. For commercial products as a whole, net sales increased by 17%.
Net sales of Cars increased by 8% and the number of cars invoiced increased
to 399,680 (386,440). A strong trend of sales for the Volvo S/V40 and sales of
the new Volvo S80, which began in August, compensated for the phasing out of
the Volvo 940 and Volvo S/V90.
The number of Volvo trucks delivered increased by 21% to 83,280 (68,980),
with the result that net sales for the business area rose by 24%, excluding
acquired units. The increase was attributable to Western Europe and North
America. Deliveries to South America decreased while net sales increased by
4% compared to the preceding year.
Buses delivered 10,200 buses and bus chassis, 1,470 more than in 1997. The
increase was largely attributable to the acquisition of Nova BUS. Buses’ net sales
increased by 4%, excluding acquired units. Net sales of Construction Equipment
rose 8%, excluding divested and acquired units.
Marine and Industrial Engines and Aero business areas also reported increases
in sales.
Items affecting comparability – provision for restructuring
During 1998 Volvo implemented a number of changes in the structure of the
Group with a view to strengthening its competitiveness and long-term profitability.
Along with these structural transactions, it was decided to take measures to
improve efficiency and reduce costs within the Group through an alignment in
the industrial structure. This alignment involves shut down, transfer or merging
of production sites. The distribution and marketing organizations are also
included in the restructuring measures.
In the consolidated accounts, SEK 2.3 billion was provided in the second and
fourth quarter for these restructuring measures. The provisions relate primarily
to costs for early retirement pensions and severance payments as well as write-
downs of fixed assets. SEK 681 M of the provisions pertain to Cars, SEK 394 M
to Trucks, SEK 422 M to Buses, SEK 158 M to Marine and Industrial Engines,
SEK 910 M to Construction Equipment and SEK 114 M to other operations.
Items affecting comparability include a capital gain of SEK 348 M on Volvo
Trucks’ sale of the rear axle production in Lindesberg, Sweden.
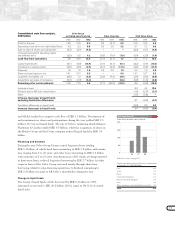
1996 1997 1998 %1)
Cars 83.6 96.5 103.8 +8
Commercial
Products 73.6 90.1 111.1 +17
Trucks 44.3 50.8 63.8 +24
Buses 8.5 10.6 14.3 +4
Construction
Equipment 12.8 16.8 19.5 +8
Marine and
Industrial Engines 3.9 4.5 4.9 +10
Aero 4.1 7.5 8.6 +15
Other companies
and eliminations (1.1) (3.0) (2.0) –
Total 156.1 183.6 212.9 +13
1) Percentage change pertains to 1998/1997,
excluding divested and aquired units.
1996 1997 1998 %1)
Volvo cars 368,250 386,440 399,680 +3
Volvo trucks 63,680 68,980 83,280 +21
Volvo buses and
bus chassis 7,410 8,730 10,200 +17
1) Percentage change pertains to 1998/1997.
Net sales by business area
80
40
0
SEK billion
96 97 98
120
Commercial Products
Cars
BOARD OF DIRECTORS’ REPORT
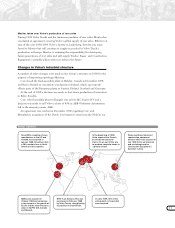
Companies Consolidated Business
acquired in 19981as from area
Carrus Oy January 1, 1998 Buses
Nova BUS April 1, 1998 Buses
Volvo Construction July 1, 1998 Construction
Equipment Korea 2Equipment
MASA October 1, 1998 Buses
BRS February 1, 1998 Trucks
1 Ownership >50%
2 Previously Samsung Heavy Industries operations of
construction equipment
For further information, see Note 2 on page 58.
1996 1997 1998 %1)
Western Europe 90.3 101.4 117.7 +16
Eastern Europe 2.8 3.9 5.3 +36
North America 36.6 51.1 66.4 +30
South America 4.8 7.0 7.0 0
Asia 16.2 15.5 12.0 (23)
Other markets 3.5 4.7 4.5 (4)
Operations
being divested 1.9 – ––
Total 156.1 183.6 212.9 +16
1) Percentage change pertains to 1998/1997.
Net sales per market area SEK billion