Volvo 1998 Annual Report Download - page 106
Download and view the complete annual report
Please find page 106 of the 1998 Volvo annual report below. You can navigate through the pages in the report by either clicking on the pages listed below, or by using the keyword search tool below to find specific information within the annual report.-
 1
1 -
2
-
3
-
4
-
5
-
6
-
7
-
8
-
9
-
10
-
11
-
12
-
13
-
14
-
15
-
16
-
17
-
18
-
19
-
20
-
21
-
22
-
23
-
24
-
25
-
26
-
27
-
28
-
29
-
30
-
31
-
32
-
33
-
34
-
35
-
36
-
37
-
38
-
39
-
40
-
41
-
42
-
43
-
44
-
45
-
46
-
47
-
48
-
49
-
50
-
51
-
52
-
53
-
54
-
55
-
56
-
57
-
58
-
59
-
60
-
61
-
62
-
63
-
64
-
65
-
66
-
67
-
68
-
69
-
70
-
71
-
72
-
73
-
74
-
75
-
76
-
77
-
78
-
79
-
80
-
81
-
82
-
83
-
84
-
85
-
86
-
87
-
88
-
89
-
90
-
91
-
92
-
93
-
94
-
95
-
 96
96 -
 97
97 -
 98
98 -
 99
99 -
 100
100 -
 101
101 -
 102
102 -
 103
103 -
 104
104 -
 105
105 -
 106
106 -
 107
107 -
 108
108 -
 109
109 -
 110
110 -
 111
111 -
 112
112
 |
 |

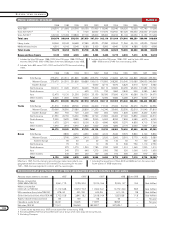
104
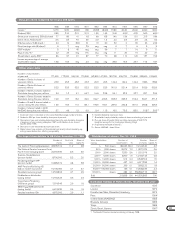
1988 1989 1990 1991 1992 1993 1994 1995 1996 1997 1998
Cars 3,478 4,329 4,851 3,895 3,346 2,462 2,502 4,561 4,901 5,055 5,839
Trucks 1,006 1,245 1,525 1,870 2,258 1,365 1,399 1,760 2,078 2,051 2,301
Buses 209 181 213 256 251 240 265 306 343 434 617
Construction Equipment — — — — — — — 221 555 627 715
Marine and Industrial Engines 124 127 178 180 166 154 148 177 183 213 270
Aero 100 151 150 163 194 196 160 150 155 205 248
Other 36 73 114 50 28 21 21 30 36 74 114
Automotive operations 4,953 6,106 7,031 6,414 6,243 4,438 4,495 7,205 8,251 8,659 10,104
Operations being divested 186 70 30 — — — 157 138 20 — —
Volvo Group, total 5,139 6,176 7,061 6,414 6,243 4,438 4,652 7,343 8,271 8,659 10,104
Figures for the years 1992 through 1996 have been adjusted to conform with the new Annual Accounts Act.
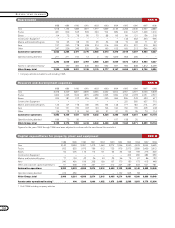
Research and development expenses SEK M
1988 1989 1990 1991 1992 1993 1994 1995 1996 1997 1998
Cars 1,018 1,154 1,389 1,591 1,577 1,869 2,149 2,283 2,345 2,557 2,880
Trucks 481 509 523 532 594 704 839 940 1,027 1,265 1,519
Buses 64 72 78 95 70 88 65 99 121 136 218
Construction Equipment — — — — — — — 143 302 394 996
Marine and Industrial Engines 55 63 58 30 95 36 58 70 68 71 67
Aero 157 240 178 208 214 216 209 219 231 215 224
Other 247 226 245 320 136 160 155 165 213 346 423
Automotive operations 2,022 2,264 2,471 2,776 2,686 3,073 3,475 3,919 4,307 4,984 6,327
Operations being divested 271 271 150 13 0 152 1,025 953 206 – –
2,293 2,535 2,621 2,789 2,686 3,225 4,500 4,872 4,513 4,984 6,327
Assets in operational leasing 1– 150 400 340 433 552 607 784 838 1,812 3,299
Volvo Group, total 2,293 2,685 3,021 3,129 3,119 3,777 5,107 5,656 5,351 6,796 9,626
1 Company vehicles included to and including 1993.
Depreciation SEK M
1988 1989 1990 1991 1992 1993 1994 1995 1996 1997 1998
Cars 2,140 3,594 3,051 1,413 1,562 2,072 1,596 2,540 4,425 5,544 5,625
Trucks 932 820 1,073 786 912 725 979 2,072 2,589 2,439 2,612
Buses 92 206 116 114 101 64 54 124 199 276 320
Construction Equipment — — — — — — — 204 286 484 630
Marine and Industrial Engines 77 104 43 36 24 35 96 79 67 86 133
Aero 240 490 156 258 199 157 170 180 173 413 448
Other and corporate capital expenditures 51 608 159 267 117 412 227 387 403 621 781
Automotive operations 3,532 5,822 4,598 2,874 2,915 3,465 3,122 5,586 8,142 9,863 10,549
Operations being divested 416 459 — — — — 1,152 905 58 – –
Volvo Group, total 3,948 6,281 4,598 2,874 2,915 3,465 4,274 6,491 8,200 9,863 10,549
Assets under operational leasing 1— 400 1,200 1,000 1,352 1,678 2,495 2,585 3,851 9,773 12,654
1 Until 1996 including company vehicles.
Capital expenditures for property, plant and equipment SEK M
ELEVEN-YEAR SUMMARY