Volvo 1998 Annual Report Download - page 18
Download and view the complete annual report
Please find page 18 of the 1998 Volvo annual report below. You can navigate through the pages in the report by either clicking on the pages listed below, or by using the keyword search tool below to find specific information within the annual report.-
 1
1 -
2
-
3
-
4
-
5
-
6
-
7
-
 8
8 -
 9
9 -
 10
10 -
 11
11 -
 12
12 -
 13
13 -
 14
14 -
 15
15 -
 16
16 -
 17
17 -
 18
18 -
 19
19 -
 20
20 -
 21
21 -
 22
22 -
 23
23 -
 24
24 -
 25
25 -
 26
26 -
 27
27 -
 28
28 -
29
-
30
-
31
-
32
-
33
-
34
-
35
-
36
-
37
-
38
-
39
-
40
-
41
-
42
-
43
-
44
-
45
-
46
-
47
-
48
-
49
-
50
-
51
-
52
-
53
-
54
-
55
-
56
-
57
-
58
-
59
-
60
-
61
-
62
-
63
-
64
-
65
-
66
-
67
-
68
-
69
-
70
-
71
-
72
-
73
-
74
-
75
-
76
-
77
-
78
-
79
-
80
-
81
-
82
-
83
-
84
-
85
-
86
-
87
-
88
-
89
-
90
-
91
-
92
-
93
-
94
-
95
-
96
-
97
-
98
-
99
-
100
-
101
-
102
-
103
-
104
-
105
-
106
-
107
-
108
-
109
-
110
-
111
-
112
 |
 |

1998
Change in net financial assets
Definitions
16
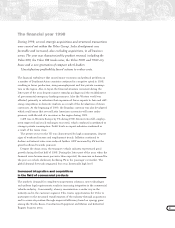
Cash flow analysis
Excluding sales financing operations, the Volvo Group’s operating cash flow
amounted to SEK 1.0 billion (7.6) (see accompanying table). The significantly
lower figure, compared with 1997, was due primarily to the fact that the trend of
profitability was not adequate to offset a less favorable trend of working capital
tied up in operations as a result of higher volumes of business. High net invest-
ments in property, plant and equipment mainly attributable to production
retooling also had an effect. The amount of working capital tied up in operations,
excluding the effects of changes in foreign exchange rates, changes in the compos-
ition of the Group, and items affecting comparability, increased by SEK 0.2 billion
during the year (decrease 5.0). The increase in capital tied up in inventories and
receivables was offset in part by higher trade payables and other operating liabil-
ities and provisions. Items affecting comparability totaling SEK 2.3 billion, which
are reported in income for the year as a result of approved restructuring measures,
did not affect the year’s cash flow to any significant degree.
The rate of growth in Volvo’s sales financing operations continued to be high,
resulting in a negative cash flow within sales financing of SEK 18.9 billion (1997:
negative cash flow of SEK 20.8 billion) after net investments. For a more detailed
presentation of Volvo’s sales-financing operations, see pages 38–39.
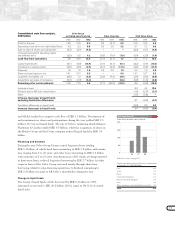
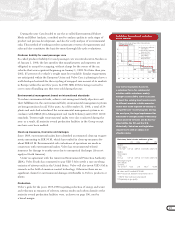
Capital expenditures
Capital expenditures for property, plant and equipment increased to SEK 10.5
billion (9.9). Capital expenditures in Volvo Cars amounted to SEK 5.6 billion
(5.5), of which the greater part pertained to continuing investments in the new,
large platform in the form of changes in the production process in Göteborg and
Ghent, to investments in type-specific tools in suppliers’ plants, and to invest-
ments in the supply of components. Capital expenditures in commercial products
amounted to SEK 4.1 billion, of which SEK 2.6 billion (2.4) pertains to Volvo
Trucks, which during the year changed production processes to the new FM series,
carried out capacity enhancement and environmental improvement measures
within the assembly and component channels and established a new cab plant in
Curitiba, Brazil.
Investments in leasing assets amounted to SEK 12.7 billion (9,8), of which
SEK 11.8 billion pertained to sales-financing operations, primarily those in
North America and Great Britain. Long-term receivables increased in a net
amount of SEK 9.9 billion (6.0), of which SEK 9.4 billion (7.2) was attributable
to continuing expansion of the loan portfolio in the sales-financing business,
notably in the form of installment credits and financial leasing.
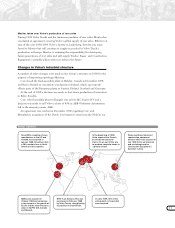
Acquisitions and divestments
Acquired and divested operations in 1998 resulted in a negative cash flow of
SEK 5.6 billion, net (1997: negative cash flow of SEK 1.3 billion), of which the
acquisition of the assets of Samsung Heavy Industries´ divison for construction
equipment accounted for SEK 3.9 billion. The acquisitions of Carrus, Nova BUS
Capital expenditures
2
6
4
0
SEK billion
96 97 98
Commercial Products
Cars
SEK billion
Cash flow from operations 10.3
Capital expenditures (10.4)
Investments in leasing assets (0.9)
Disposals 1.5
Long-term operational receivables, net 0.5
Operating cash flow, Volvo Group
excluding sales financing 1.0
Dividend to AB Volvo’s shareholders (2.2)
Acquired and divested operations 1(5.0)
Shares and participations, net 5.5
Infusion of capital to sales-
financing companies, net (2.2)
Other including changes in exchange rates (1.4)
Total change (4.3)
1) Of which, purchase amount SEK 5.0 billion and net
financial debt in acquired and divested companies
SEK 0.0 billion.
Operating cash flow,
excluding sales financing
Cash flow from year’s operations with
deductions for net investments in property,
plant and equipment, leasing assets and
long-term operating receivables.
BOARD OF DIRECTORS’ REPORT
1996 1997 1998
Cars 4.4 5.5 5.6
Commercial Products 3.3 3.7 4,1
Other 0.5 0.7 0.8
Volvo Group, total 8.2 9.9 10.5