Volvo 1998 Annual Report Download - page 105
Download and view the complete annual report
Please find page 105 of the 1998 Volvo annual report below. You can navigate through the pages in the report by either clicking on the pages listed below, or by using the keyword search tool below to find specific information within the annual report.-
 1
1 -
2
-
3
-
4
-
5
-
6
-
7
-
8
-
9
-
10
-
11
-
12
-
13
-
14
-
15
-
16
-
17
-
18
-
19
-
20
-
21
-
22
-
23
-
24
-
25
-
26
-
27
-
28
-
29
-
30
-
31
-
32
-
33
-
34
-
35
-
36
-
37
-
38
-
39
-
40
-
41
-
42
-
43
-
44
-
45
-
46
-
47
-
48
-
49
-
50
-
51
-
52
-
53
-
54
-
55
-
56
-
57
-
58
-
59
-
60
-
61
-
62
-
63
-
64
-
65
-
66
-
67
-
68
-
69
-
70
-
71
-
72
-
73
-
74
-
75
-
76
-
77
-
78
-
79
-
80
-
81
-
82
-
83
-
84
-
85
-
86
-
87
-
88
-
89
-
90
-
91
-
92
-
93
-
94
-
 95
95 -
 96
96 -
 97
97 -
 98
98 -
 99
99 -
 100
100 -
 101
101 -
 102
102 -
 103
103 -
 104
104 -
 105
105 -
 106
106 -
 107
107 -
 108
108 -
 109
109 -
 110
110 -
 111
111 -
 112
112
 |
 |

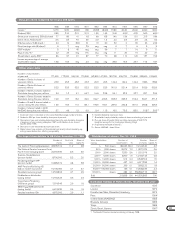
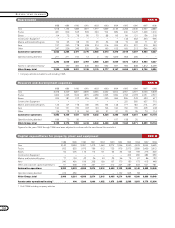
1988 1989 1990 1991 1992 1993 1994 1995 1996 1997 1998
Cars 2,680 1,168 (957) (1,597) (1,691) 626 2,771 1,089 1,498 4,510 3,808
Trucks 2,736 2,058 1,114 941 (619) 585 4,051 5,073 878 1,812 3,061
Buses 286 228 53 (166) 71 313 318 405 331 550 385
Construction Equipment1— — — — — — — 717 1,162 1,444 1,549
Marine and Industrial Engines 161 93 20 (113) (76) 125 223 212 (27) 181 95
Aero 240 248 8 202 305 143 60 103 153 472 527
Other and eliminations 898 (68) (35) (103) 108 121 63 (106) (376) (551) (415)
Automotive operations 7,001 3,727 203 (836) (1,902) 1,913 7,486 7,493 3,619 8,418 9,010
Operations being divested, etc. 90 1,090 364 — — — 1,885 1,531 91 — —
Operating income, excluding
items affecting comparability 7,091 4,817 567 (836) (1,902) 1,913 9,371 9,024 3,710 8,418 9,010
Items affecting comparability:
Cars — — (1,700) — (807) — — — — — (681)
Trucks — — (350) — (270) — — — — — (46)
Buses — — (300) — — — — — — — (422)
Construction Equipment — — — — — — — — — — (910)
Marine and Industrial Engines — — (50) — (108) — — — — — (158)
Aero — — — — (44) — — — — — —
Other and eliminations 113 313 (50) — (221) (1,600) — (1,817) — — (114)
Automotive operations 113 313 (2,450) — (1,450) (1,600) — (1,817) — — (2,331)
Operations being divested, etc. — — — — — — — 3,032 — — —
Group total 113 313 (2,450) — (1,450) (1,600) — 1,215 — — (2,331)
Operating income 7,204 5,130 (1,883) (836) (3,352) 313 9,371 10,239 3,710 8,418 6,679
1988 1989 1990 1991 1992 1993 1994 1995 1996 1997 1998
Cars 7.0 2.8 (2.4) (4.3) (3.8) 1.1 3.8 1.3 1.8 4.7 3.7
Trucks 10.5 7.1 4.1 3.4 (2.4) 1.7 8.8 9.9 2.0 3.6 4.8
Buses 8.5 6.2 1.3 (4.3) 1.6 5.7 5.2 5.3 3.9 5.2 2.7
Construction Equipment 1— — — — — — — 12.3 9.1 8.6 8.0
Marine and Industrial Engines 6.2 3.4 0.7 (4.4) (3.0) 4.2 6.0 5.5 (0.7) 4.1 1.9
Aero 9.6 9.4 0.3 5.5 8.9 3.9 1.7 2.7 3.7 6.3 6.1
Operating margin, excluding items
affecting comparability 7.3 5.3 0.7 (1.1) (2.3) 1.7 6.0 5.3 2.4 4.6 4.2
Operating margin, total 7.5 5.6 (2.3) (1.1) (4.0) 0.3 6.0 6.0 2.4 4.6 3.1
1988 1989 1990 1991 1992 1993 1994 1995 1996 1997 1998
Cars >25 14 neg neg neg 4 21 8 12 >25 24
Trucks >25 >25 21 12 neg 8 >25 >25 10 18 >25
Buses >25 18 4 neg 5 18 22 18 12 17 8
Construction Equipment — — — — — — — >25 23 23 18
Marine and Industrial Engines 16 13 5 neg neg 11 19 17 neg 14 7
Aero 117 17 neg 12 22 11 5 13 19 >25 23
1 Included in the Volvo Group as of mid-year 1995. Operating income for the Construction Equipment business area in the years 1991 through 1995, cal-
culated using the average rate for the U.S. dollar for each year, amounted to SEK (193) M, SEK (436) M, SEK 502 M, SEK 1,621 M and SEK 1,679 M.
1 Included in the Volvo Group as of mid-year 1995. The operating margin for the Construction Equipment business area for the years 1991 through 1995
amounted to (2.3), (5.5), 5.2, 13.4 and 12.3 respectively.
1 As of 1997, return on operating capital for Aero is excluding AGES.
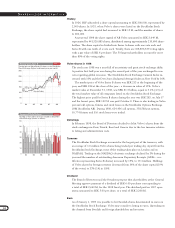
Operating income SEK M
Operating margin %
Return on operating capital, excluding items affecting comparability %