Volvo 1998 Annual Report Download - page 67
Download and view the complete annual report
Please find page 67 of the 1998 Volvo annual report below. You can navigate through the pages in the report by either clicking on the pages listed below, or by using the keyword search tool below to find specific information within the annual report.-
 1
1 -
2
-
3
-
4
-
5
-
6
-
7
-
8
-
9
-
10
-
11
-
12
-
13
-
14
-
15
-
16
-
17
-
18
-
19
-
20
-
21
-
22
-
23
-
24
-
25
-
26
-
27
-
28
-
29
-
30
-
31
-
32
-
33
-
34
-
35
-
36
-
37
-
38
-
39
-
40
-
41
-
42
-
43
-
44
-
45
-
46
-
47
-
48
-
49
-
50
-
51
-
52
-
53
-
54
-
55
-
56
-
 57
57 -
 58
58 -
 59
59 -
 60
60 -
 61
61 -
 62
62 -
 63
63 -
 64
64 -
 65
65 -
 66
66 -
 67
67 -
 68
68 -
 69
69 -
 70
70 -
 71
71 -
 72
72 -
 73
73 -
 74
74 -
 75
75 -
 76
76 -
 77
77 -
78
-
79
-
80
-
81
-
82
-
83
-
84
-
85
-
86
-
87
-
88
-
89
-
90
-
91
-
92
-
93
-
94
-
95
-
96
-
97
-
98
-
99
-
100
-
101
-
102
-
103
-
104
-
105
-
106
-
107
-
108
-
109
-
110
-
111
-
112
 |
 |

65
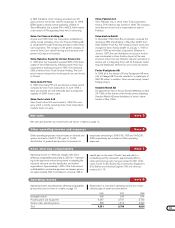
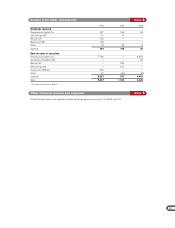
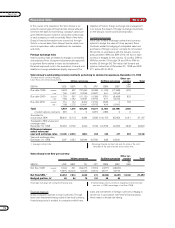
Changes in the Volvo Group’s holdings of shares and participations: 1997 1998
Balance sheet, December 31, preceding year 12,412 4,583
Acquisitions and divestments, net (8,212) (931)
New issue of shares and shareholders’ contributions 172 107
Share of income in associated companies 222 204
Dividends (145) (634)
Write-downs (11) (6)
Translation differences 32 11
Other 113 59
Balance sheet, December 31 4,583 3,393
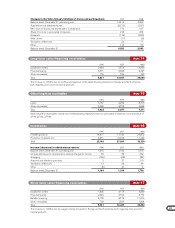
Increase (decrease) in obsolescence reserve 1996 1997 1998
Balance sheet, December 31, preceding year 1,218 1,184 1,310
Increase (decrease) in obsolescence reserve charged to income 93 89 232
Scrapping (136) (48) (84)
Acquired and divested operations 2 37 210
Translation differences 13 28 66
Other (6) 20 4
Balance sheet, December 31 1,184 1,310 1,738
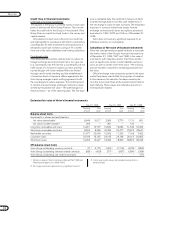
1996 1997 1998
Installment credits 2,084 7,572 14,956
Financial leasing 3,571 5,606 9,297
Other receivables 176 789 293
Total 5,831 13,967 24,546
The increase in 1998 is due to continuous expansion of the sales-financing business in Europe and North America,
both regarding Cars and commercial products.
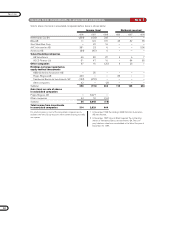
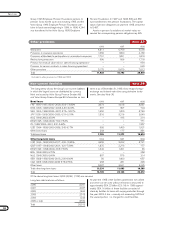
1996 1997 1998
Loans 3,157 2,269 3,313
Other receivables 4,268 3,708 3,858
Total 7,425 5,977 7,171
Other long-term receivables include non interest-bearing debenture loans to associated companies at nominal value of
2,700 (2,732; 2,759).
1996 1997 1998
Finished products 14,477 17,785 20,872
Production materials, etc. 8,671 10,208 11,256
Total 23,148 27,993 32,128
1996 1997 1998
Installment credits 1,805 4,173 4,859
Financial leasing 2,946 3,794 3,774
Retailer financing 4,178 8,775 11,815
Other receivables 792 1,595 1,804
Total 9,721 18,337 22,252
The increase in 1998 is due to a larger volume of credits in Europe and North America, both regarding Cars and com-
mercial products.
Long-term sales-financing receivables Note 14
Other long-term receivables Note 15
Inventories Note 16
Short-term sales-financing receivables Note 17