Volvo 1998 Annual Report Download - page 76
Download and view the complete annual report
Please find page 76 of the 1998 Volvo annual report below. You can navigate through the pages in the report by either clicking on the pages listed below, or by using the keyword search tool below to find specific information within the annual report.-
 1
1 -
2
-
3
-
4
-
5
-
6
-
7
-
8
-
9
-
10
-
11
-
12
-
13
-
14
-
15
-
16
-
17
-
18
-
19
-
20
-
21
-
22
-
23
-
24
-
25
-
26
-
27
-
28
-
29
-
30
-
31
-
32
-
33
-
34
-
35
-
36
-
37
-
38
-
39
-
40
-
41
-
42
-
43
-
44
-
45
-
46
-
47
-
48
-
49
-
50
-
51
-
52
-
53
-
54
-
55
-
56
-
57
-
58
-
59
-
60
-
61
-
62
-
63
-
64
-
65
-
 66
66 -
 67
67 -
 68
68 -
 69
69 -
 70
70 -
 71
71 -
 72
72 -
 73
73 -
 74
74 -
 75
75 -
 76
76 -
 77
77 -
 78
78 -
 79
79 -
 80
80 -
 81
81 -
 82
82 -
 83
83 -
 84
84 -
 85
85 -
 86
86 -
87
-
88
-
89
-
90
-
91
-
92
-
93
-
94
-
95
-
96
-
97
-
98
-
99
-
100
-
101
-
102
-
103
-
104
-
105
-
106
-
107
-
108
-
109
-
110
-
111
-
112
 |
 |
74
NOTE S
Credit risks in financial instruments
Credit risk in financial investments
The liquidity in the Group is invested mainly in local cash
pools or directly with Volvo Group Finance. This concen-
trates the credit risk to the Group’s in-house bank. Volvo
Group Finance invests the liquid funds in the money and
capital markets.
All investments must meet criteria for low credit risk
and high liquidity. In accordance with Volvo’s credit policy,
counterparties for both investments and transactions in
derivatives must have received a rating of “A” or better
from one of the well-established credit-rating institutions.
Counterparty risks
TThe derivative instruments used by Volvo to reduce its
foreign-exchange and interest-rate risk in turn give rise
to a counterparty risk, the risk that a counterparty will not
fulfill its part of a forward or options contract, and that
a potential gain will not be realized. Risks are limited
through careful credit checking and the establishment
of maximum levels of exposure. Where appropriate, the
Volvo Group arranges master netting agreements with
the counterparty to reduce exposure. The credit exposure
in interest-rate and foreign exchange contracts is repre-
sented by the positive fair value – the potential gain on
these contracts – as of the reporting date. The risk expo-
sure is calculated daily. The credit risk in futures contracts
is limited through daily or monthly cash settlements of
the net change in value of open contracts. The estimated
exposure in currency interest-rate swaps, forward
exchange contracts and futures and options purchased
amounted to 1,362, 3,970 and 193 as of December 31,
1998.
Volvo does not have any significant exposure to an
individual customer or counterparty.
Calculation of fair value of financial instruments
Volvo has used generally accepted methods to calculate
the market value of the Group’s financial instruments as
of December 31, 1996, 1997 and 1998. In the case of
instruments with maturities shorter than three months –
such as liquid funds, certain current liabilities and provi-
sions, as well as certain short-term loans – the carrying
amount has been assumed to closely approximate mar-
ket value.
Official exchange rates and prices quoted in the open
market have been used initially for purposes of valuation.
In their absence, the valuation has been made by dis-
counting future cash flows at the market interest rate for
each maturity. These values are estimates and will not
necessarily be realized.
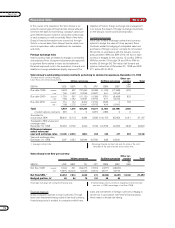
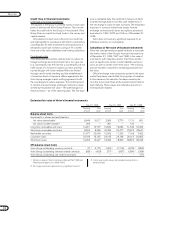
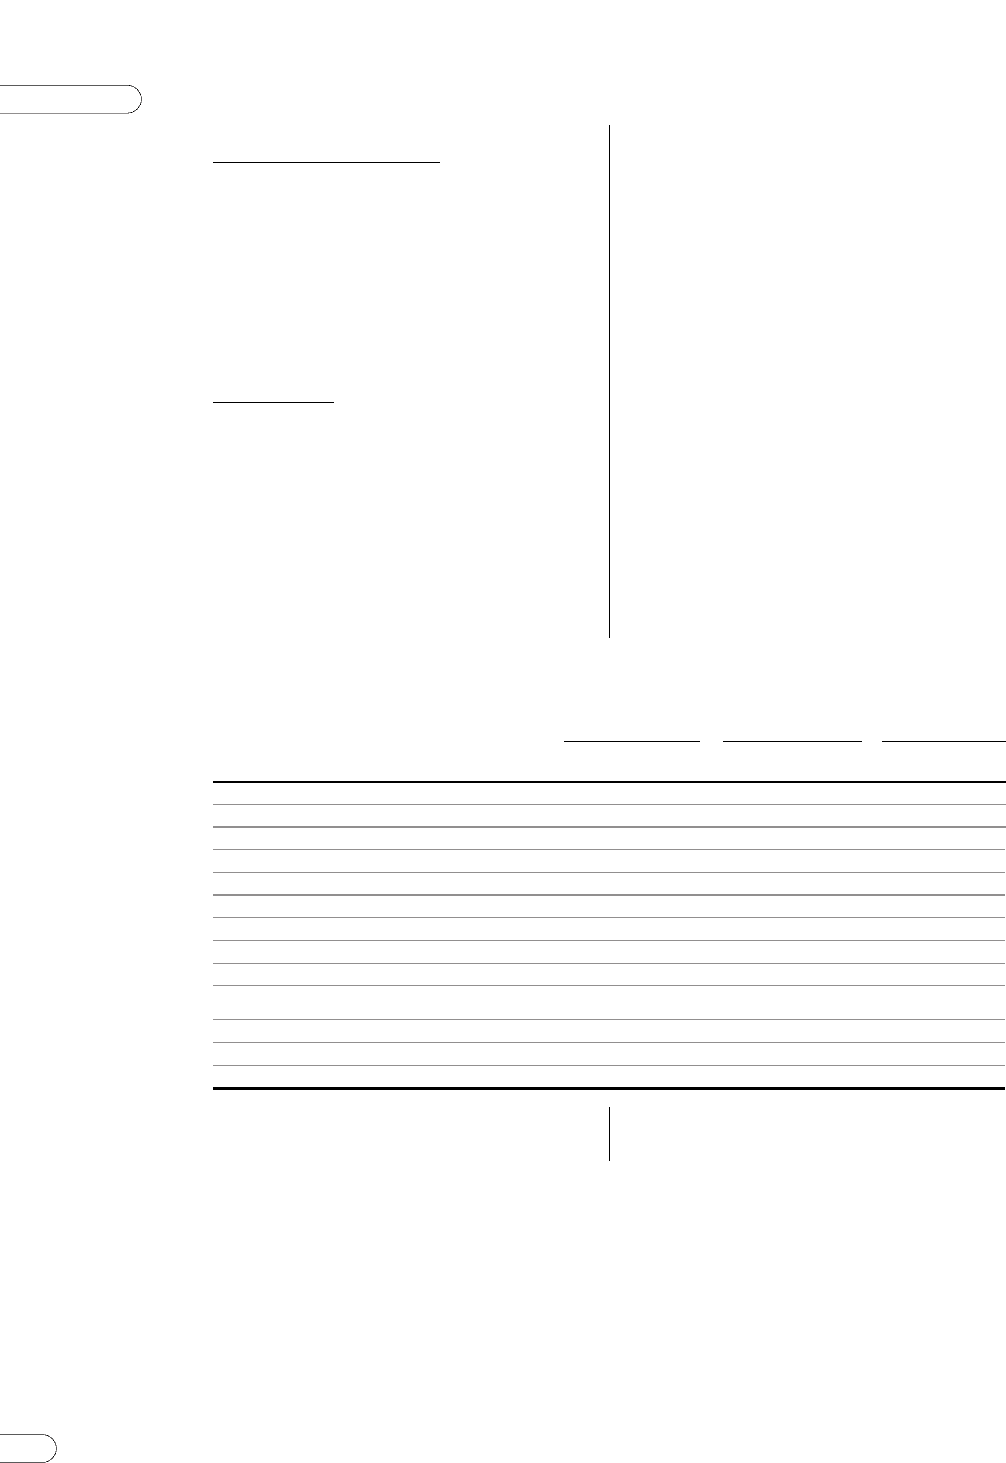
Estimated fair value of Volvo’s financial instruments
Dec 31, 1996 Dec 31, 1997 Dec 31, 1998
Carrying Fair Carrying Fair Carrying Fair
amount value amount value amount value
Balance sheet items
Investments in shares and participations
fair value determinable 18,646 9,917 2,089 5,779 1,110 851
fair value not determinable 2206 — 361 — 132 —
Long-term receivables and loans 12,991 12,797 19,690 19,682 31,349 31,362
Short-term receivables and loans 8,599 8,365 20,459 20,477 23,674 23,641
Marketable securities 21,577 22,059 10,962 11,203 7,168 7,562
Long-term loans 18,189 18,145 23,135 24,168 26,012 26,882
Short-term loans 14,263 14,427 18,282 18,309 38,876 39,025
Off-balance-sheet items
Volvo Group outstanding currency contracts 47 33,179 (199) 3(1,716) (673) 3(896)
Volvo Group outstanding interests related contracts (85) 3(423) (77) 3(957) (334) 3(266)
Volvo Group outstanding raw material contracts – – – – – (77)
1 Pertains mainly to Volvo’s holdings in Renault SA 1996 and
Pharmacia & Upjohn, Inc 1996–1997.
2 No single investment represents any significant amount.
3 Carrying amounts values are included among items in
balance sheet.