Volvo 1998 Annual Report Download - page 33
Download and view the complete annual report
Please find page 33 of the 1998 Volvo annual report below. You can navigate through the pages in the report by either clicking on the pages listed below, or by using the keyword search tool below to find specific information within the annual report.-
 1
1 -
2
-
3
-
4
-
5
-
6
-
7
-
8
-
9
-
10
-
11
-
12
-
13
-
14
-
15
-
16
-
17
-
18
-
19
-
20
-
21
-
22
-
 23
23 -
 24
24 -
 25
25 -
 26
26 -
 27
27 -
 28
28 -
 29
29 -
 30
30 -
 31
31 -
 32
32 -
 33
33 -
 34
34 -
 35
35 -
 36
36 -
 37
37 -
 38
38 -
 39
39 -
 40
40 -
 41
41 -
 42
42 -
 43
43 -
44
-
45
-
46
-
47
-
48
-
49
-
50
-
51
-
52
-
53
-
54
-
55
-
56
-
57
-
58
-
59
-
60
-
61
-
62
-
63
-
64
-
65
-
66
-
67
-
68
-
69
-
70
-
71
-
72
-
73
-
74
-
75
-
76
-
77
-
78
-
79
-
80
-
81
-
82
-
83
-
84
-
85
-
86
-
87
-
88
-
89
-
90
-
91
-
92
-
93
-
94
-
95
-
96
-
97
-
98
-
99
-
100
-
101
-
102
-
103
-
104
-
105
-
106
-
107
-
108
-
109
-
110
-
111
-
112
 |
 |
31
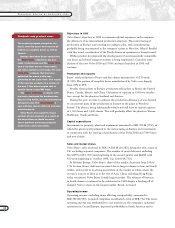
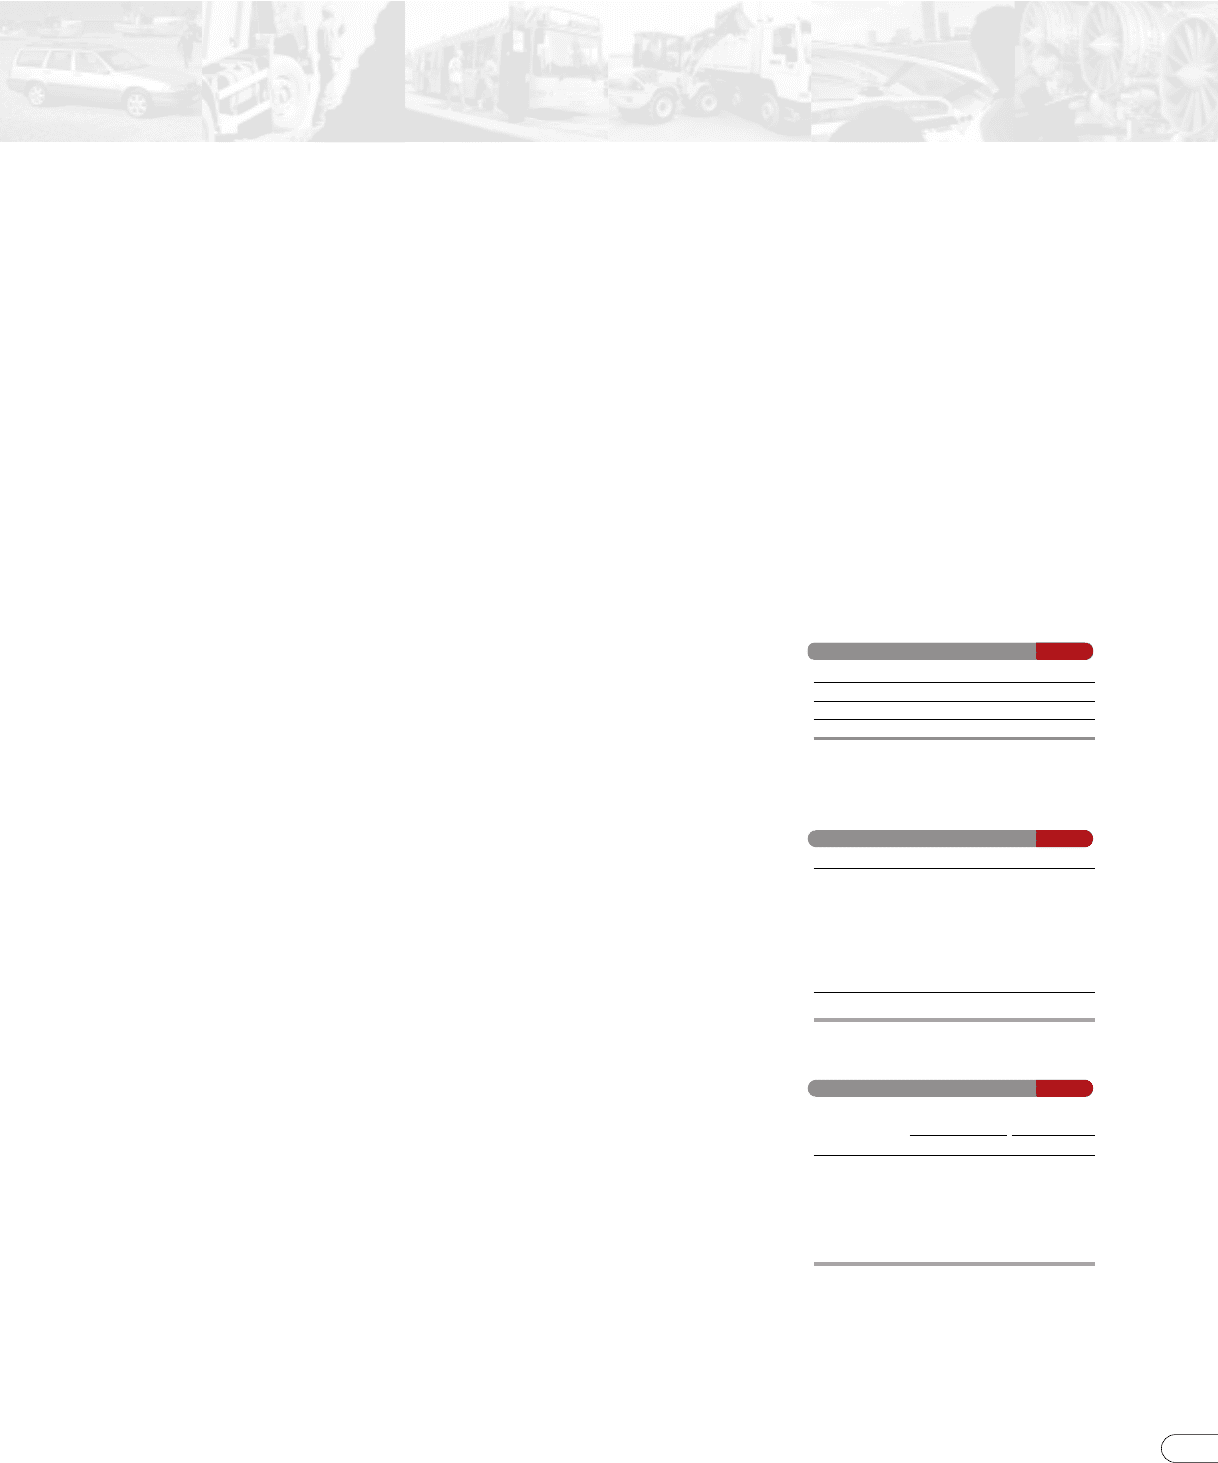
SEK M 1996 1997 1998
Net sales 8,527 10,582 14,286
Operating income1331 550 385
Operating margin, %13.9 5.2 2.7
1 Excluding items affecting comparability during
1998. Including items affecting comparability, of
SEK 422 M, operating loss amounted to SEK 37 M
and operating margin was (0.3)%.
1996 1997 1998
Western Europe 3,770 4,030 3,580
Eastern Europe 70 160 280
North America 1750 1,110 2,730
South America 1,460 1,350 1,510
Asia 1,060 1,410 1,650
Other countries 300 670 450
Total 7,410 8,730 10,200
1 Including the acqusitions of Nova BUS and MASA
as of second respectively fourth quarter of 1998.
Volvo buses Market share,
registrations %
1997 1998 1997 1998
United States 1 3 650 1,630 n.a. n.a.
Great Britain 1,450 1,510 62.7 53.6
Brazil 1920 1,090 7.5 9.0
China 12 860 730 n.a. n.a.
Canada 1 3 200 500 n.a. n.a.
1Delivery from factory.
2 Including Hong Kong
3 Including the acquisition of Nova BUS as of second
quarter of 1998.
Key ratios Buses
Number of vehicles invoiced Buses
Largest markets Buses
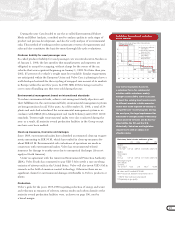
Operating income
Trucks’ operating income, excluding items affecting comparability, increased to
SEK 3,061 M (1,812), attributable to higher sales volumes in Europe and North
America, lower costs of purchase, high capacity utilization in the industrial
system as well as a favorable price trend in North America. This offset higher
costs for development and introduction of the FM series and the new FH gener-
ation. Operating margin, excluding items affecting comparability, rose to 4.8%
(3.6) and return on operating capital exceeded 25% (18). Operating margin in
the fourth quarter 1998 was 6.0%.
Combined, costs of SEK 394 M, pertaining to closing of production facilities
in Irvine, Scotland and changes in Trucks’ dealer structure as well as a gain on
the sale and of the rear-axle plant in Lindesberg of SEK 348 M, resulted in an
expense item affecting comparability of SEK 46 M. Operating income, including
items affecting comparability, amounted to SEK 3,015 M (1,812).
Buses
Demand for buses with total weights exceeding 12 tons was affected in a
negative way by the economic downturn in Asia and South America. The
markets for buses in Western Europe and North America however, increased,
preliminarily by 15% and 13%, respectively. The business is characterized by the
fact that as a result of increasing deregulation and privatization more and more
city and inter-city bus operations are being taken over by international operators
who are imposing increasingly higher demands on manufacturers in terms of
products and services.
Competitors
Volvo Buses participates actively in the restructuring of the bus industry, which
also is expected to continue. The competition is increasing more and more and
the manufacturers strive for larger volumes to achieve benefits of scale. Volvo is
the world’s second-largest manufacturer of buses and bus chassis with total
weights of more than 12 tons. Mercedes is the largest. Renault and Iveco’s bus
operations, which were merged in 1998, make up the world’s third-largest
producer.
Acquisitions
Nova BUS, which has production facilities in Canada (St Eustache) and the
United States (Roswell and Schenectady), was in January 1998 acquired through
Prévost, which is 51% owned by Volvo. In October, Volvo Buses acquired
MASA, a bus manufacturer with production in Tultitlan, near Mexico City. They
are included in the Volvo Group’s accounts as of second respectively fourth
quarter 1998. The acquisitions mean that Volvo Buses now has an industrial base
in Canada as well as in the US and Mexico (NAFTA). The operations comprise
the development and production of citybuses, inter-city buses and tourist buses.
In January 1998 the acquisition of Finnish Carrus Oy was completed.