Volvo 1998 Annual Report Download - page 70
Download and view the complete annual report
Please find page 70 of the 1998 Volvo annual report below. You can navigate through the pages in the report by either clicking on the pages listed below, or by using the keyword search tool below to find specific information within the annual report.-
 1
1 -
2
-
3
-
4
-
5
-
6
-
7
-
8
-
9
-
10
-
11
-
12
-
13
-
14
-
15
-
16
-
17
-
18
-
19
-
20
-
21
-
22
-
23
-
24
-
25
-
26
-
27
-
28
-
29
-
30
-
31
-
32
-
33
-
34
-
35
-
36
-
37
-
38
-
39
-
40
-
41
-
42
-
43
-
44
-
45
-
46
-
47
-
48
-
49
-
50
-
51
-
52
-
53
-
54
-
55
-
56
-
57
-
58
-
59
-
 60
60 -
 61
61 -
 62
62 -
 63
63 -
 64
64 -
 65
65 -
 66
66 -
 67
67 -
 68
68 -
 69
69 -
 70
70 -
 71
71 -
 72
72 -
 73
73 -
 74
74 -
 75
75 -
 76
76 -
 77
77 -
 78
78 -
 79
79 -
 80
80 -
81
-
82
-
83
-
84
-
85
-
86
-
87
-
88
-
89
-
90
-
91
-
92
-
93
-
94
-
95
-
96
-
97
-
98
-
99
-
100
-
101
-
102
-
103
-
104
-
105
-
106
-
107
-
108
-
109
-
110
-
111
-
112
 |
 |
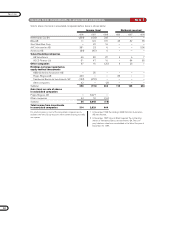
68
NOTE S
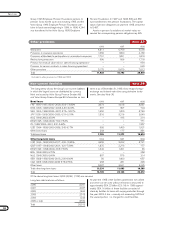
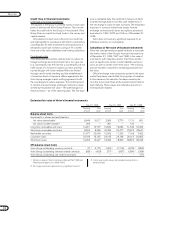
1996 1997 1998
Warranties 4,811 5,769 6,599
Provisions in insurance operations 1,650 1,890 2,139
Provisions attributable to participations in associated companies 1,701 1,851 1,819
Restructuring measures 596 556 1,718
Provison for residual value risks in sales-financing operations1– – 954
Provision for service contracts in sales-financing operations1– – 629
Other provisions 3,175 5,679 7,012
Total 11,933 15,745 20,870
1 Included in other provisons in 1996 and 1997.
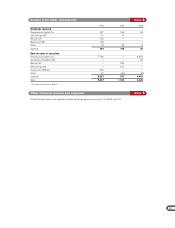
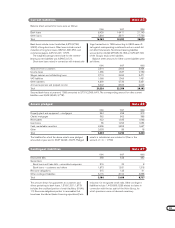
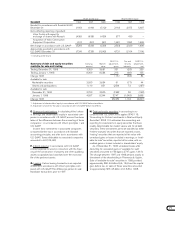
The listing below shows the Group’s non-current liabilities
in which the largest loans are distributed by currency.
Most are issued by Volvo Group Finance Sweden AB
and Volvo Group Finance Europe BV. Information on loan
terms is as of December 31, 1998. Volvo hedges foreign-
exchange and interest-rate risks using derivative instru-
ments. See also Note 30.
Bond loans 1996 1997 1998
FRF 1995–1997/2000–2009, 3.93–7.632% 3,674 4,618 3,887
DKK 1996–1998/2002–2005, 4.30–6.00% 357 357 704
SEK 1992–1998/2000–2007, 3.75–12.51% 1,450 1,300 3,749
JPY 1995–1998/2000–2005, 0.19–5.10% 1,316 3,216 2,640
NLG 1996/2003, 3.54% – 195 214
DEM 1995–1996/2000, 7.50–7.52% – – 771
ITL 1988/2000–2001, 5.31-5.42% – – 1.357
USD 1984–1998/2000-2008, 3.45-6.17% 955 1,409 1,921
Other bond loans 203 177 381
Total bond loans 7,955 11,272 15,624
Other long-term loans 1996 1997 1998
USD 1990–1998/2000-2017, 4.00-13.65% 2,655 3,222 3,721
GBP 1997–1998/2000-2001, 6.31-7.86% 1,875 2,273 777
DEM 1994–1998/2000, 4.55–7.60% 1,442 1,491 46
BRL 1996/2000, 6.70% – – 258
NLG 1996/2000, 6.60% 857 575 214
SEK 1988–1998/2000-2013, 2.00-9.00% 50 1,400 657
CAD 1995-1998/2000-2008, 5.78-9.76% 258 281 490
Other loans 3,097 2,621 4,225
Total other long-term loans 10,234 11,863 10,388
Total 18,189 23,135 26,012
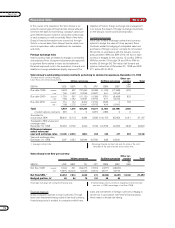
Long-term debt matures as follows:
2000 8,207
2001 4,027
2002 1,460
2003 2,313
2004 1,223
2005 or later 8,782
Total 26,012
At year-end 1998 credit facilities granted but not utilized
and which can be used without restrictions amounted to
approximately SEK 22 billion (22; 16). In 1998 approxi-
mately SEK 16 billion of these facilities consisted of
stand-by facilities for loans with varying maturities through
the year 2003. A fee – normally not exceeding 0.25% of
the unused portion – is charged for credit facilities.
Of the above long-term loans, 2,823 (2,992; 1,109) was secured.
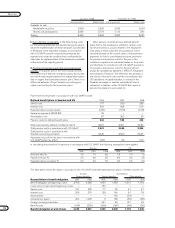
Group 1995 Employee Pension Foundation pertains to
pension funds earned up to and including 1995 and the
Volvo Group 1996 Employee Pension Foundation per-
tains to funds earned beginning in 1996. In 1996, 4,244
was transferred to the Volvo Group 1995 Employee
Pension Foundation. In 1997 and 1998, 396 and 339
was transferred to the pension foundations. The capital
value of pension obligations at year-end 1998 amounted
to 5,487.
Assets in pension foundations at market value, ex-
ceeded the corresponding pension obligations by 425.
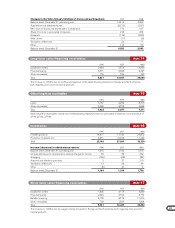
Other provisions Note 23
Non-current liabilities Note 24