Volvo 1998 Annual Report Download - page 107
Download and view the complete annual report
Please find page 107 of the 1998 Volvo annual report below. You can navigate through the pages in the report by either clicking on the pages listed below, or by using the keyword search tool below to find specific information within the annual report.-
 1
1 -
2
-
3
-
4
-
5
-
6
-
7
-
8
-
9
-
10
-
11
-
12
-
13
-
14
-
15
-
16
-
17
-
18
-
19
-
20
-
21
-
22
-
23
-
24
-
25
-
26
-
27
-
28
-
29
-
30
-
31
-
32
-
33
-
34
-
35
-
36
-
37
-
38
-
39
-
40
-
41
-
42
-
43
-
44
-
45
-
46
-
47
-
48
-
49
-
50
-
51
-
52
-
53
-
54
-
55
-
56
-
57
-
58
-
59
-
60
-
61
-
62
-
63
-
64
-
65
-
66
-
67
-
68
-
69
-
70
-
71
-
72
-
73
-
74
-
75
-
76
-
77
-
78
-
79
-
80
-
81
-
82
-
83
-
84
-
85
-
86
-
87
-
88
-
89
-
90
-
91
-
92
-
93
-
94
-
95
-
96
-
 97
97 -
 98
98 -
 99
99 -
 100
100 -
 101
101 -
 102
102 -
 103
103 -
 104
104 -
 105
105 -
 106
106 -
 107
107 -
 108
108 -
 109
109 -
 110
110 -
 111
111 -
 112
112
 |
 |
105
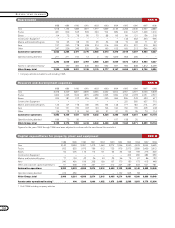
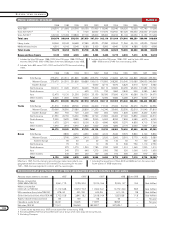
1988 1989 1990 1991 1992 1993 1994 1995 1996 1997 1998
Sweden 54,970 54,740 47,260 42,960 39,130 43,980 44,880 47,000 43,330 43,650 43,900
Europe, excluding Sweden 14,530 14,180 12,180 11,630 12,040 16,280 18,040 16,930 15,290 16,100 17,880
North America 5,680 6,040 5,720 5,320 5,540 6,950 6,100 7,860 6,900 8,450 12,100
South America 1,890 2,010 1,940 1,730 1,520 3,400 3,400 3,620 2,130 2,000 1,980
Asia 850 1,030 1,270 1,460 1,380 2,170 2,380 2,830 2,260 1,720 3,340
Other markets 690 690 430 480 510 860 750 810 420 980 620
Volvo Group, total 78,610 78,690 68,800 63,580 60,120 73,640 75,550 79,050 70,330 72,900 79,820
1988 1989 1990 1991 1992 1993 1994 1995 1996 1997 1998
Western Europe 46,072 50,658 56,200 71,763 86,056 90,322 101,510 117,724
Eastern Europe 560 927 1,385 1,636 2,222 2,794 3,939 5,268
Europe total 44,018 45,670 46,463 46,632 51,585 57,585 73,399 88,278 93,116 105,449 122,992
North America 22,978 26,218 21,398 18,285 19,828 31,364 37,034 39,011 36,560 51,052 66,433
South America 2,419 2,362 4,334 6,324 7,117 4,844 6,983 7,010
Asia 8,170 7,208 11,842 14,372 17,097 16,151 15,545 11,962
Other markets 8,024 9,786 10,802 1,717 2,019 2,074 2,799 2,993 3,546 4,596 4,539
Automotive operations 75,020 81,674 78,663 77,223 83,002 107,199 133,928 154,496 154,217 183,625 212,936
Operations being divested 21,619 9,298 4,522 — — 3,956 21,938 17,015 1,843 – –
Volvo Group, total 96,639 90,972 83,185 77,223 83,002 111,155 155,866 171,511 156,060 183,625 212,936
of which Sweden 12,199 12,282 10,968 10,994 11,010 12,154 14,083 16,223 16,631 19,816 21,479
1988 1989 1990 1991 1992 1993 1994 1995 1996 1997 1998
Sweden 2,589 4,424 2,943 2,046 2,046 2,788 2,208 3,918 5,586 6,809 6,601
Europe, excluding Sweden 580 1,081 1,320 583 502 438 432 871 1,655 1,475 2,113
North America 289 207 191 125 83 130 354 557 649 916 1,026
South America 8 416 377
Asia 28 214 351
Other markets 74 110 144 120 284 109 128 240 216 33 81
Automotive operations 3,532 5,822 4,598 2,874 2,915 3,465 3,122 5,586 8,142 9,863 10,549
Operations being divested 416 459 — — — — 1,152 905 58 – –
Volvo Group, total 3,948 6,281 4,598 2,874 2,915 3,465 4,274 6,491 8,200 9,863 10,549
Assets under operational leasing 1— 400 1,200 1,000 1,352 1,678 2,495 2,585 3,851 9,773 12,654
1 Until 1996 including company vehicles.
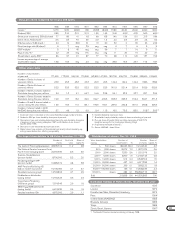
MARKETAREASTATISTICS
Effective in 1997, the Volvo Group's accounting per market area reflects geographical definitions based on ISO standard. The accounting for the years
1991–1996 has been adjusted to conform with the new principle.
Net sales SEK M
Capital expenditures for property, plant and equipment SEK M
Employees Number