Volvo 1998 Annual Report Download - page 56
Download and view the complete annual report
Please find page 56 of the 1998 Volvo annual report below. You can navigate through the pages in the report by either clicking on the pages listed below, or by using the keyword search tool below to find specific information within the annual report.-
 1
1 -
2
-
3
-
4
-
5
-
6
-
7
-
8
-
9
-
10
-
11
-
12
-
13
-
14
-
15
-
16
-
17
-
18
-
19
-
20
-
21
-
22
-
23
-
24
-
25
-
26
-
27
-
28
-
29
-
30
-
31
-
32
-
33
-
34
-
35
-
36
-
37
-
38
-
39
-
40
-
41
-
42
-
43
-
44
-
45
-
 46
46 -
 47
47 -
 48
48 -
 49
49 -
 50
50 -
 51
51 -
 52
52 -
 53
53 -
 54
54 -
 55
55 -
 56
56 -
 57
57 -
 58
58 -
 59
59 -
 60
60 -
 61
61 -
 62
62 -
 63
63 -
 64
64 -
 65
65 -
 66
66 -
67
-
68
-
69
-
70
-
71
-
72
-
73
-
74
-
75
-
76
-
77
-
78
-
79
-
80
-
81
-
82
-
83
-
84
-
85
-
86
-
87
-
88
-
89
-
90
-
91
-
92
-
93
-
94
-
95
-
96
-
97
-
98
-
99
-
100
-
101
-
102
-
103
-
104
-
105
-
106
-
107
-
108
-
109
-
110
-
111
-
112
 |
 |

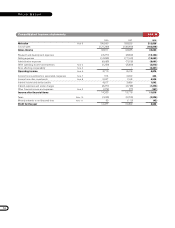
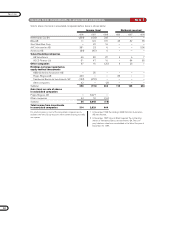
54
VOLVO GROUP
1996 1997 1998
Year’s operations
Profit for the year 12,477 10,359 8,638
Depreciation and amortization 5,351 6,796 9,626
Income from investments in associated companies after taxes (222) 220 (400)
Dividends received from associated companies 119 145 634
Gain on sales of securities (8,169) (4,068) (4,469)
Gain on sales of subsidiaries — — (366)
Minority interests after taxes (99) 112 42
Increase in current assets
Receivables (4,777) (7,452) (6,592)
Inventories ( 547) (2,575) (1,306)
Increase (decrease) in current operating liabilities
and other provisions (618) 7,280 6,888
Increase (decrease) in deferred tax liabilities 23 (5,919) 711 (2,036) (669) (1,679)
Cash flow from year’s operations 3,538 11,528 12,026
Investments (increase)
Property, plant and equipment etc:
Capital expenditures for property, plant and equipment (8,200) (9,863) (10,549)
Investments in leasing vehicles (3,851) (9,773) (12,654)
Disposals 1,958 1.855 2,777
Investments in shares, net 14,080 10,669 5,504
Long-term receivables, net (2,804) (6,031) (9,884)
Acquired and divested operations (878) 305 (1,303) (14,446) (5,622) (30,428)
Remaining after net investments 3,843 (2,918) (18,402)
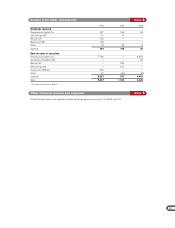
Financing, dividends etc
Increase in short-term bank loans and other loans 5,151 995 18,872
Increase (decrease) in long-term loans and
provisions for post-empolyments benefits (1,844) 3,404 1,043
Increase (decrease) in minority interests 45 (21) 68
Dividends paid to AB Volvo shareholders (1,854) (1,993) (2,208)
Dividends paid to minority shareholders (33) (83) (59)
Redemption of shares — (5,807) —
New issue of shares — 116 —
Settlement of loan to Renault (1,536) — —
Other (121) (192) (22) (3,411) — 17,716
Increase (decrease) in liquid funds
excluding translation differences 3,651 (6,329) (686)
Translation differences on liquid funds (296) 271 307
Increase (decrease) in liquid funds 3,355 (6,058) (379)
Liquid funds, January 1 23,306 26,661 20,603
Liquid funds, December 31 26,661 20,603 20,224
In the cash flow analysis, the effects of major acquisitions and divestments of sub-
sidiaries in each year, including the distribution of the shareholding in Swedish
Match 1996, have been excluded from other changes in the balance sheet. The
effects of changes in foreign exchange rates on translation on foreign subsidiaries
have been excluded, since they do not affect cash flow. Liquid funds include Cash
and bank accounts and Marketable securities.
Cash flow analysis SEK M