Volvo 1998 Annual Report Download - page 17
Download and view the complete annual report
Please find page 17 of the 1998 Volvo annual report below. You can navigate through the pages in the report by either clicking on the pages listed below, or by using the keyword search tool below to find specific information within the annual report.-
 1
1 -
2
-
3
-
4
-
5
-
6
-
 7
7 -
 8
8 -
 9
9 -
 10
10 -
 11
11 -
 12
12 -
 13
13 -
 14
14 -
 15
15 -
 16
16 -
 17
17 -
 18
18 -
 19
19 -
 20
20 -
 21
21 -
 22
22 -
 23
23 -
 24
24 -
 25
25 -
 26
26 -
 27
27 -
28
-
29
-
30
-
31
-
32
-
33
-
34
-
35
-
36
-
37
-
38
-
39
-
40
-
41
-
42
-
43
-
44
-
45
-
46
-
47
-
48
-
49
-
50
-
51
-
52
-
53
-
54
-
55
-
56
-
57
-
58
-
59
-
60
-
61
-
62
-
63
-
64
-
65
-
66
-
67
-
68
-
69
-
70
-
71
-
72
-
73
-
74
-
75
-
76
-
77
-
78
-
79
-
80
-
81
-
82
-
83
-
84
-
85
-
86
-
87
-
88
-
89
-
90
-
91
-
92
-
93
-
94
-
95
-
96
-
97
-
98
-
99
-
100
-
101
-
102
-
103
-
104
-
105
-
106
-
107
-
108
-
109
-
110
-
111
-
112
 |
 |

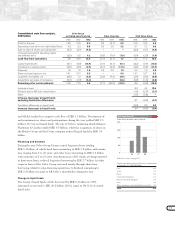
Volvo Group consolidated balance Volvo Group,
sheets, December 31, SEK billion excl sales financing 1Sales financing Total Volvo Group
1996 1997 1998 1996 1997 1998 1996 1997 1998
Assets
Intangible assets 2.3 3.3 5.7 0.0 0.0 0.1 2.3 3.3 5.8
Property, plant and equipment 26.5 30.7 36.0 0.0 0.1 0.2 26.5 30.8 36.2
Assets under operating leases 0.1 1.4 1.8 4.9 12.1 20.5 5.0 13.5 22.3
Shares and participations 114.8 8.1 9.7 0.6 0.7 0.7 12.4 4.6 3.4
Long-term sales-financing receivables 0.0 0.2 0.1 5.8 13.8 24.4 5.8 14.0 24.5
Long-term interest bearing receivables 3.1 2.2 3.3 0.0 0.0 0.0 3.1 2.2 3.3
Other long-term receivables 3.9 3.7 3.7 0.4 0.0 0.2 4.3 3.7 3.9
Inventories 23.0 27.8 31.9 0.1 0.2 0.2 23.1 28.0 32.1
Short-term sales-financing receivables 0.0 0.0 0.1 9.7 18.3 22.2 9.7 18.3 22.3
Short-term interest bearing receivables 0.9 2.4 1.4 0.0 0.0 0.0 0.9 2.4 1.4
Other short-term receivables 20.9 21.0 26.9 0.5 0.9 2.1 21.4 21.9 29.0
Marketable securities 21.6 11.0 6.9 0.0 0.0 0.3 21.6 11.0 7.2
Cash and bank accounts 4.4 8.8 11.9 0.7 0.8 1.1 5.1 9.6 13.0
Assets 121.5 120.6 139.4 22.7 46.9 72.0 141.2 163.3 204.4
Shareholders’ equity and liabilities
Shareholders’ equity 57.9 60.4 68.1 3.0 4.2 7.0 57.9 60.4 68.1
Minority interests 0.4 0.9 0.8 0.1 0.0 0.1 0.5 0.9 0.9
Provisions for post-
employment benefits 3.1 3.3 2.9 0.0 0.0 0.0 3.1 3.3 2.9
Other provisions 14.7 18.3 21.9 0.3 1.4 3.3 15.0 19.7 25.2
Loans 15.1 2.1 5.9 17.4 39.1 58.3 32.5 41.2 64.2
Other liabilities 30.3 35.6 39.8 1.9 2.2 3.3 32.2 37.8 43.1
Shareholders’ equity and liabilities 121.5 120.6 139.4 22.7 46.9 72.0 141.2 163.3 204.4
Shareholders’ equity and minority
interests as percentage of total assets 48.0 50.8 49.4 13.5 9.1 9.8 41.4 37.6 33.7
1 Sales-financing operations are reported in accordance with the equity method. Internal receivables and liabilities related to the sales-financing operations are excluded.
15
Financial position
Total assets of the Volvo Group increased by SEK 41.1 billion, to SEK 204.4
billion, during the year. The increase was primarily attributable to the continuing
expansion of sales-financing operations amounting to SEK 21.8 billion, to
changes in the composition of the Group totaling SEK 8.7 billion, and to the
effect of changes in foreign exchange rates, SEK 5.6 billion. The remainder of
the increase, amounting to SEK 5.0 billion, was due mainly to tangible assets,
inventories and current receivables resulting from high investments and larger
volumes of business. The part of the increase attributable to acquired operations
included goodwill amounting to SEK 2.5 billion.
Shareholders’ equity increased by SEK 7.6 billion in 1998. Net income for the
year increased equity by SEK 8.6 billion while the dividend reduced equity by
SEK 2.2 billion. The weakening of the Swedish krona during the year caused an
increase of SEK 1.2 billion in shareholders’ equity, including the effect of
hedging of net investments in foreign subsidiaries and associated companies,
through borrowing in foreign currencies.
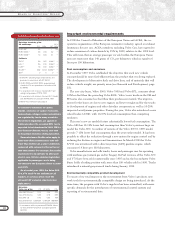
Volvo Group net financial assets amounted to SEK 14.8 billion (19.1) at year-
end.The decline during 1998 of SEK 4.3 billion is specified in the table on page 16.
Net financial assets
20
10
40
096 97 98
20.6
31.2
as % of shareholders’ equity and minority interests
30
21.5