Volvo 1998 Annual Report Download - page 108
Download and view the complete annual report
Please find page 108 of the 1998 Volvo annual report below. You can navigate through the pages in the report by either clicking on the pages listed below, or by using the keyword search tool below to find specific information within the annual report.-
 1
1 -
2
-
3
-
4
-
5
-
6
-
7
-
8
-
9
-
10
-
11
-
12
-
13
-
14
-
15
-
16
-
17
-
18
-
19
-
20
-
21
-
22
-
23
-
24
-
25
-
26
-
27
-
28
-
29
-
30
-
31
-
32
-
33
-
34
-
35
-
36
-
37
-
38
-
39
-
40
-
41
-
42
-
43
-
44
-
45
-
46
-
47
-
48
-
49
-
50
-
51
-
52
-
53
-
54
-
55
-
56
-
57
-
58
-
59
-
60
-
61
-
62
-
63
-
64
-
65
-
66
-
67
-
68
-
69
-
70
-
71
-
72
-
73
-
74
-
75
-
76
-
77
-
78
-
79
-
80
-
81
-
82
-
83
-
84
-
85
-
86
-
87
-
88
-
89
-
90
-
91
-
92
-
93
-
94
-
95
-
96
-
97
-
 98
98 -
 99
99 -
 100
100 -
 101
101 -
 102
102 -
 103
103 -
 104
104 -
 105
105 -
 106
106 -
 107
107 -
 108
108 -
 109
109 -
 110
110 -
 111
111 -
 112
112
 |
 |

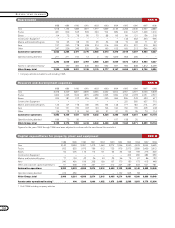
1 Includes the Volvo 200 series 1988–1993, Volvo 700 series 1988–1992 and
the Volvo 900, S/V90 1990–1998. Sales of the Volvo S80 began in July 1998.
2 Includes Volvo 800 series 1991–1997 and the S/V/C70 from and including
1997.
3 Includes the Volvo 300 series 1988–1991 and the Volvo 400 series
1988–1996 and the S/V40 from and including 1996.
106
1988 1989 1990 1991 1992 1993 1994 1995 1996 1997 1998
Volvo S80 1278,370 271,800 237,350 193,130 171,450 115,040 92,040 106,520 72,550 67,740 37,590
Volvo S/V/C70 20 0 0 7,720 42,660 101,670 163,760 187,020 196,650 204,550 210,830
Volvo S/V40 3120,100 127,200 118,800 97,100 93,200 85,400 95,200 81,100 99,050 114,150 151,260
Total, cars 398,470 399,000 356,150 297,950 307,310 302,110 351,000 374,640 368,250 386,440 399,680
Heavy trucks 52,960 53,040 50,680 47,580 43,030 47,280 63,560 71,360 59,100 63,930 78,690
Medium-heavy trucks 6,510 6,160 5,040 6,180 5,100 3,950 4,940 5,130 4,580 5,050 4,590
Total, trucks 59,470 59,200 55,720 53,760 48,130 51,230 68,500 76,490 63,680 68,980 83,280
Buses and bus chassis 5,120 5,550 4,830 4,650 5,580 5,450 5,770 6,830 7,410 8,730 10,200
1988 1989 1990 1991 1992 1993 1994 1995 1996 1997 1998
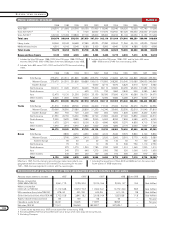
Cars Total Europe 275,670 261,310 231,890 199,880 205,270 179,560 214,950 225,160 224,890 239,960 255,540
Western Europe 275,670 261,310 231,890 199,880 199,610 170,850 208,280 219,340 219,980 234,050 249,560
Eastern Europe — — — — 5,660 8,710 6,670 5,820 4,910 5,910 5,980
North America 100,910 111,020 93,270 69,290 75,400 80,110 90,820 99,230 95,660 101,980 110,700
South America — — — 620 210 720 1,860 2,840 950 2,280 1,860
Asia 12,470 15,120 21,250 20,520 23,130 35,330 37,690 42,130 40,280 36,170 24,970
Other markets 9,420 11,550 9,740 7,640 3,300 6,390 5,680 5,280 6,470 6,050 6,610
Total 398,470 399,000 356,150 297,950 307,310 302,110 351,000 374,640 368,250 386,440 399,680
Trucks Total Europe 31,310 31,300 28,700 27,000 22,200 17,100 27,000 34,160 34,970 34,470 42,350
Western Europe 30,960 30,550 27,980 25,800 21,250 16,240 25,450 32,330 32,310 31,040 37,810
Eastern Europe 350 750 720 1,200 950 860 1,550 1,830 2,660 3,430 4,540
North America 21,530 20,150 16,460 13,380 16,720 21,860 26,460 27,090 16,850 20,900 29,310
South America 3,290 3,630 3,980 3,480 3,590 5,900 8,320 7,800 4,980 6,970 6,020
Asia 1,670 2,210 4,610 8,100 4,120 4,840 4,830 5,270 4,850 4,710 3,760
Other markets 1,670 1,910 1,970 1,800 1,500 1,530 1,890 2,170 2,030 1,930 1,840
Total 59,470 59,200 55,720 53,760 48,130 51,230 68,500 76,490 63,680 68,980 83,280
Buses Total Europe 3,830 2,970 2,430 2,360 2,610 3,040 3,570 3,840 4,190 3,860
Western Europe 3,740 2,940 2,410 2,320 2,520 2,900 3,510 3,770 4,030 3,580
Eastern Europe 90 30 20 40 90 140 60 70 160 280
North America 70 30 — 10 30 10 340 750 1,110 2,730
South America 970 1,070 1,340 1,780 1,320 1,630 1,510 1,460 1,350 1,510
Asia 240 270 640 1,270 1,050 780 920 1,060 1,410 1,650
Other markets 440 490 240 160 440 310 490 300 670 450
Total 5,120 5,550 4,830 4,650 5,580 5,450 5,770 6,830 7,410 8,730 10,200
Effective in 1997, the Volvo Group's accounting per market area reflects new
geographical definitions based on ISO standard. The accounting for the years
1991–1996, has been adjusted to conform with the new principle.
1 Including the acquisitions of Nova BUS and MASA as from the second and
fourth quarter of 1998 respectively.
Volvo vehicles invoiced Number
ELEVEN-YEAR SUMMARY
1
Absolute values: relative to net sales 1995 11996 11997 11998 Goal 1998 Comments
Energy consumption
(GWh; MWh/SEK M) 2,961; 17.3 3,135; 20.0 3,019; 16.6 3,045; 14.7 15.4 Goal fulfilled
Water consumption
(´000 m3; m3/SEK M) 11,112; 64.8 10,972; 70.3 11,692; 64.1 10,172; 49.0 58.3 Goal fulfilled
NOx emissions (tons; kilos/SEK M) 678; 4.0 591; 3.8 644; 3.5 611; 2.9 3.8 Goal fulfilled
Solvent emissions (tons; kilos/SEK M) 2,702; 15.8 2,841; 18.2 2,618; 14.4 1,823; 8.8 11.8 Goal fulfilled
Sulphur dioxide emissions (tons) 135 149 98 63 — No goal
Hazardous waste (tons) 16,041 16,905 17,877 18,593 — No goal
Net sales, SEK M 171,511 156,060 182,293 3207,539 2——
1 Certain values adjusted since 1997 annual report after review during 1998.
2 Excluding MASA, VCE Korea, Nova BUS and Carrus Group, which were acquired during the year.
3 Excluding Champion.
Environmental performance of Volvo production plants relative to net sales