Volvo 1998 Annual Report Download - page 16
Download and view the complete annual report
Please find page 16 of the 1998 Volvo annual report below. You can navigate through the pages in the report by either clicking on the pages listed below, or by using the keyword search tool below to find specific information within the annual report.-
 1
1 -
2
-
3
-
4
-
5
-
 6
6 -
 7
7 -
 8
8 -
 9
9 -
 10
10 -
 11
11 -
 12
12 -
 13
13 -
 14
14 -
 15
15 -
 16
16 -
 17
17 -
 18
18 -
 19
19 -
 20
20 -
 21
21 -
 22
22 -
 23
23 -
 24
24 -
 25
25 -
 26
26 -
27
-
28
-
29
-
30
-
31
-
32
-
33
-
34
-
35
-
36
-
37
-
38
-
39
-
40
-
41
-
42
-
43
-
44
-
45
-
46
-
47
-
48
-
49
-
50
-
51
-
52
-
53
-
54
-
55
-
56
-
57
-
58
-
59
-
60
-
61
-
62
-
63
-
64
-
65
-
66
-
67
-
68
-
69
-
70
-
71
-
72
-
73
-
74
-
75
-
76
-
77
-
78
-
79
-
80
-
81
-
82
-
83
-
84
-
85
-
86
-
87
-
88
-
89
-
90
-
91
-
92
-
93
-
94
-
95
-
96
-
97
-
98
-
99
-
100
-
101
-
102
-
103
-
104
-
105
-
106
-
107
-
108
-
109
-
110
-
111
-
112
 |
 |

14
Impact of foreign exchange rates on operating income
The Swedish krona weakened during 1998 against several currencies, which
favorably affected inflow currencies, mainly the USD, GBP and the ITL, and
adversely affected outflow currencies, primarily the BEF, NLG and DEM. The
net effect of changes in spot rates was positive in a total amount of SEK 1.0
billion. Because Volvo hedges large portions of its payment flows in foreign
currencies through forward contracts, changes in spot exchange rates do not have
an immediate effect on operating income. In 1998, the effect on income of
forward and option contracts amounted to a loss of SEK 0.6 billion (1997: loss
of SEK 1.2 billion), which resulted in a positive impact of SEK 0.6 billion on
operating income for 1998, compared with 1997.
Changes in spot rates in connection with the translation of income in foreign
subsidiaries and the revaluation of balance sheet items in foreign currencies had
a positive impact of SEK 0.4 billion.
Consequently, the total effect of changes in foreign exchange rates on Group
operating income for 1998 compared with 1997 was SEK 2.0 billion.
Financial items
Income from investments in associated companies amounted to SEK 0.4 billion
(2.9) and consisted primarily of income from investments in NedCar, Bilia AB
and AB Volvofinans. The difference relative to the preceding year was attribut-
able to a gain of SEK 3.0 billion on the sale of the shareholding in Pripps
Ringnes AB, in 1997.
Income from other shares and participations included the profit of SEK 4.5
billion that arose in connection with the sale of Volvo’s entire shareholding in
Pharmacia & Upjohn, Inc. Net interest income of SEK 0.1 billion (0.7) was
generated through a return of 5.6% on interest-bearing assets and average
borrowing costs of 8.8%. The lower net interest income compared with the
preceding year was due primarily to lower average net financial assets and lower
interest rates in Europe. The Group’s expansion in certain growth markets such
as South Korea, Eastern Europe and South America also involved local financing
at high rates of interest in these markets.
Taxes
Tax expense rose to SEK 2.9 billion (2.7) and was equal to an average rate of
25% (21). Tax expenses consist largely of current tax.
Minority interest in income
The minority interest in the Volvo Group consists mainly of the Henlys Group’s
holding (49%) in Prévost Inc and Nova BUS, as well as Hitachi Construction
Machinery’s stake (40%) regarding Euclid Hitachi Heavy Equipment Inc up to
and including September, and the minority’s holding (43%) in The AGES Group
ALP.
Profit for the year
Profit for the year amounted to SEK 8.6 billion (10.4) and the return on equity,
excluding items affecting comparability and gain on sale of shares, was 10.3%
(10.4).
BOARD OF DIRECTORS’ REPORT
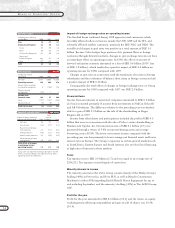
excluding items affecting
comparability 1996 1997 1998
Cars 1.8 4.7 3.7
Commercial Products 3.4 4.9 5.1
Trucks 2.0 3.6 4.8
Buses 3.9 5.2 2.7
Construction Equipment 9.1 8.6 8.0
Marine and
Industrial Engines neg. 4.1 1.9
Aero 3.7 6.3 6.1
Total 2.4 4.6 4.2
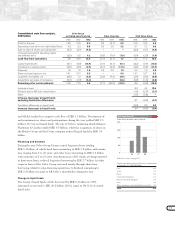
Com-
Impact of foreign exchange mercial
rates on operating income Cars Products Total
Net sales 2.0 2.1 4.1
Cost of sales (1.4) (0.7) (2.1)
Research and develop-
ment expenses 0.0 (0.1) (0.1)
Selling expenses (0.2) (0.1) (0.3)
Administrative expenses 0.0 (0.2) (0.2)
Other operating income
and expenses 0.9 (0.3) 0.6
Total effect of changes
in exchange rate on
operating income 1.3 0.7 2.0
Group sales are reported at average spot prices and the
effects of currency hedges are reported among “Other
operating income and expenses”.
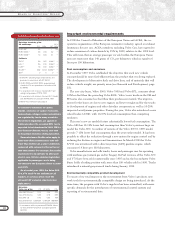
Operating margin %
Condensed income
statements 1996 1997 1998
Net sales 5,101 5,956 10,268
Operating income 146 202 470
Income from investments
in associated companies 6 (146) 109
Financial income
and expenses (16) 1 1
Income after
financial items 136 57 580
Taxes (137) (167) (295)
Minority interests (4) (6) 4
Profit for the year (5) (116) 289
Sales financing SEK M
Impact of exchange rates SEK billion