Volvo 1998 Annual Report Download - page 93
Download and view the complete annual report
Please find page 93 of the 1998 Volvo annual report below. You can navigate through the pages in the report by either clicking on the pages listed below, or by using the keyword search tool below to find specific information within the annual report.-
 1
1 -
2
-
3
-
4
-
5
-
6
-
7
-
8
-
9
-
10
-
11
-
12
-
13
-
14
-
15
-
16
-
17
-
18
-
19
-
20
-
21
-
22
-
23
-
24
-
25
-
26
-
27
-
28
-
29
-
30
-
31
-
32
-
33
-
34
-
35
-
36
-
37
-
38
-
39
-
40
-
41
-
42
-
43
-
44
-
45
-
46
-
47
-
48
-
49
-
50
-
51
-
52
-
53
-
54
-
55
-
56
-
57
-
58
-
59
-
60
-
61
-
62
-
63
-
64
-
65
-
66
-
67
-
68
-
69
-
70
-
71
-
72
-
73
-
74
-
75
-
76
-
77
-
78
-
79
-
80
-
81
-
82
-
 83
83 -
 84
84 -
 85
85 -
 86
86 -
 87
87 -
 88
88 -
 89
89 -
 90
90 -
 91
91 -
 92
92 -
 93
93 -
 94
94 -
 95
95 -
 96
96 -
 97
97 -
 98
98 -
 99
99 -
 100
100 -
 101
101 -
 102
102 -
 103
103 -
104
-
105
-
106
-
107
-
108
-
109
-
110
-
111
-
112
 |
 |

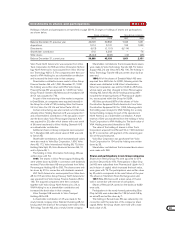
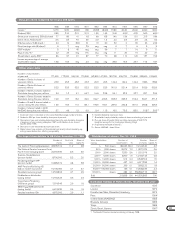
Volvo Group Volvo Cars
Net sales 212.9 103.8
Operating income 19.0 3.8
Operating margin, % 14.2 3.7
1 Excluding items affecting comparability.
91
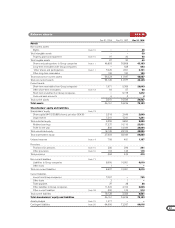
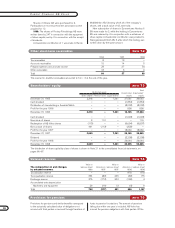
Pro forma balance sheet and key ratios
The pro forma balance sheet shows the position of the
Volvo Group as of December 31, 1998, adjusted to
reflect the effects of the divestment of Volvo Cars (see
pages 6-8). The purpose of the pro forma balance sheet
is to illustrate the immediate effects on the consolidated
financial position due to the divestment of Volvo Cars.
The capital gain for accounting purposes on the sale
amounts to SEK 26.2 billion. The sale reduces the
operating capital in the Volvo Group by SEK 18.3 billion
and increases net financial assets by SEK 46.7 billion.
Total assets within sales-financing operations is being
reduced by SEK 35.7 billion.
Further adjustments are reclassifications of receiv-
ables and liabilities between Volvo Cars and other Volvo
Group companies.
VOLVO GROUP AFTER THE DIVESTMENT OF VOLVO CARS
Pro forma
Volvo Group
Volvo Group Divestment of after divestment
Dec 31 1998 Volvo Cars Adjustments and adjustment
Assets
Intangible non-current assets 5.8 0.0 0.0 5.8
Tangible non-current assets 58.5 30.6 0.2 28.1
Financial non-current assets 35.1 16.6 11.0 29.5
Inventories 32.1 11.3 0.0 20.8
Short-term receivables 52.7 30.6 32.1 54.2
Marketable securities 7.2 0.0 – 7.2
Cash and bank accounts 13.0 7.1 39.6 45.5
Total assets 204.4 96.2 82.9 191.1
Shareholders' equity and liabilities
Shareholders' equity168.1 18.8 39.1 88.4
Minority interests 0.9 0.1 – 0.8
Provisions 28.1 12.9 6.2 21.4
Loans 64.2 37.2 28.3 55.3
Other liabilities 43.1 27.2 9.3 25.2
Shareholders' equity and liabilities 204.4 96.2 82.9 191.1
Net financial assets/liabilities 14.8 (0.9) 45.8 61.5
1 Since the definitive tax effect of the sale cannot yet be calculated,
a standard rate of 28% is applied to the accounting gain in the
pro forma balance sheet.
Volvo Group pro forma balance sheet SEK billion
Key ratios 1998 SEK billion