US Airways 2008 Annual Report Download - page 97
Download and view the complete annual report
Please find page 97 of the 2008 US Airways annual report below. You can navigate through the pages in the report by either clicking on the pages listed below, or by using the keyword search tool below to find specific information within the annual report.-
 1
1 -
2
-
3
-
4
-
5
-
6
-
7
-
8
-
9
-
10
-
11
-
12
-
13
-
14
-
15
-
16
-
17
-
18
-
19
-
20
-
21
-
22
-
23
-
24
-
25
-
26
-
27
-
28
-
29
-
30
-
31
-
32
-
33
-
34
-
35
-
36
-
37
-
38
-
39
-
40
-
41
-
42
-
43
-
44
-
45
-
46
-
47
-
48
-
49
-
50
-
51
-
52
-
53
-
54
-
55
-
56
-
57
-
58
-
59
-
60
-
61
-
62
-
63
-
64
-
65
-
66
-
67
-
68
-
69
-
70
-
71
-
72
-
73
-
74
-
75
-
76
-
77
-
78
-
79
-
80
-
81
-
82
-
83
-
84
-
85
-
86
-
 87
87 -
 88
88 -
 89
89 -
 90
90 -
 91
91 -
 92
92 -
 93
93 -
 94
94 -
 95
95 -
 96
96 -
 97
97 -
 98
98 -
 99
99 -
 100
100 -
 101
101 -
 102
102 -
 103
103 -
 104
104 -
 105
105 -
 106
106 -
 107
107 -
108
-
109
-
110
-
111
-
112
-
113
-
114
-
115
-
116
-
117
-
118
-
119
-
120
-
121
-
122
-
123
-
124
-
125
-
126
-
127
-
128
-
129
-
130
-
131
-
132
-
133
-
134
-
135
-
136
-
137
-
138
-
139
-
140
-
141
-
142
-
143
-
144
-
145
-
146
-
147
-
148
-
149
-
150
-
151
-
152
-
153
-
154
-
155
-
156
-
157
-
158
-
159
-
160
-
161
-
162
-
163
-
164
-
165
-
166
-
167
-
168
-
169
-
170
-
171
-
172
-
173
-
174
-
175
-
176
-
177
-
178
-
179
-
180
-
181
-
182
-
183
-
184
-
185
-
186
-
187
-
188
-
189
-
190
-
191
-
192
-
193
-
194
-
195
-
196
-
197
-
198
-
199
-
200
-
201
-
202
-
203
-
204
-
205
-
206
-
207
-
208
-
209
-
210
-
211
-
212
-
213
-
214
-
215
-
216
-
217
-
218
-
219
-
220
-
221
-
222
-
223
-
224
-
225
-
226
-
227
-
228
-
229
-
230
-
231
-
232
-
233
-
234
-
235
-
236
-
237
-
238
-
239
-
240
-
241
-
242
-
243
-
244
-
245
-
246
-
247
-
248
-
249
-
250
-
251
-
252
-
253
-
254
-
255
-
256
-
257
-
258
-
259
-
260
-
261
-
262
-
263
-
264
-
265
-
266
-
267
-
268
-
269
-
270
-
271
-
272
-
273
-
274
-
275
-
276
-
277
-
278
-
279
-
280
-
281
-
282
-
283
-
284
-
285
-
286
-
287
-
288
-
289
-
290
-
291
-
292
-
293
-
294
-
295
-
296
-
297
-
298
-
299
-
300
-
301
-
302
-
303
-
304
-
305
-
306
-
307
-
308
-
309
-
310
-
311
-
312
-
313
-
314
-
315
-
316
-
317
-
318
-
319
-
320
-
321
-
322
-
323
-
324
-
325
-
326
-
327
-
328
-
329
-
330
-
331
-
332
-
333
-
334
-
335
-
336
-
337
-
338
-
339
-
340
-
341
-
342
-
343
-
344
-
345
-
346
-
347
-
348
-
349
-
350
-
351
-
352
-
353
-
354
-
355
-
356
-
357
-
358
-
359
-
360
-
361
-
362
-
363
-
364
-
365
-
366
-
367
-
368
-
369
-
370
-
371
-
372
-
373
-
374
-
375
-
376
-
377
-
378
-
379
-
380
-
381
-
382
-
383
-
384
-
385
-
386
-
387
-
388
-
389
-
390
-
391
-
392
-
393
-
394
-
395
-
396
-
397
-
398
-
399
-
400
-
401
 |
 |

Table of Contents
US Airways Group, Inc.
Notes to Consolidated Financial Statements — (Continued)
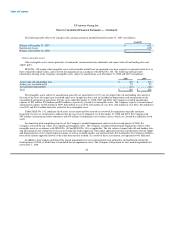
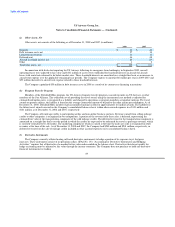
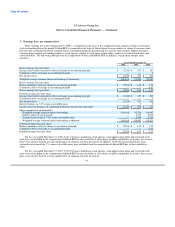
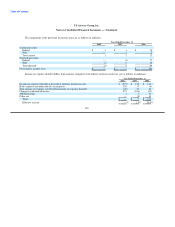
3. Earnings (loss) per common share
Basic earnings (loss) per common share ("EPS") is computed on the basis of the weighted average number of shares of common
stock outstanding during the period. Diluted EPS is computed on the basis of the weighted average number of shares of common stock
plus the effect of dilutive potential common shares outstanding during the period using the treasury stock method. Dilutive potential
common shares include outstanding employee stock options, employee stock appreciation rights, employee restricted stock units and
convertible debt. The following table presents the computation of basic and diluted EPS (in millions, except share and per share
amounts):
Year Ended December 31,
2008 2007 2006
Basic earnings (loss) per share:
Income (loss) before cumulative effect of change in accounting principle $ (2,210) $ 427 $ 303
Cumulative effect of change in accounting principle — — 1
Net income (loss) $ (2,210) $ 427 $ 304
Weighted average common shares outstanding (in thousands) 100,168 91,536 86,447
Basic earnings (loss) per share:
Before cumulative effect of change in accounting principle $ (22.06) $ 4.66 $ 3.50
Cumulative effect of change in accounting principle — — 0.01
Basic earnings (loss) per share $ (22.06) $ 4.66 $ 3.51
Diluted earnings (loss) per share:
Income (loss) before cumulative effect of change in accounting principle $ (2,210) $ 427 $ 303
Cumulative effect of change in accounting principle — — 1
Net income (loss) (2,210) 427 304
Interest expense on 7.0% senior convertible notes — 5 9
Income (loss) for purposes of computing diluted net income (loss) per share $ (2,210) $ 432 $ 313
Share computation (in thousands):
Weighted average common shares outstanding 100,168 91,536 86,447
Dilutive effect of stock awards — 1,017 2,058
Assumed conversion of 7.0% senior convertible notes — 3,050 5,316
Weighted average common shares outstanding as adjusted 100,168 95,603 93,821
Diluted earnings (loss) per share:
Before cumulative effect of change in accounting principle $ (22.06) $ 4.52 $ 3.32
Cumulative effect of change in accounting principle — — 0.01
Diluted earnings (loss) per share $ (22.06) $ 4.52 $ 3.33
For the year ended December 31, 2008, 8,181,340 shares underlying stock options, stock appreciation rights and restricted stock
units were not included in the computation of diluted EPS because inclusion of such shares would be antidilutive or because the exercise
prices were greater than the average market price of common stock for the period. In addition, 3,050,148 incremental shares from
assumed conversion of the 7% senior convertible notes were excluded from the computation of diluted EPS due to their antidilutive
effect.
For the year ended December 31, 2007, 2,916,762 shares underlying stock options, stock appreciation rights and restricted stock
units were not included in the computation of diluted EPS because inclusion of such shares would be antidilutive or because the exercise
prices were greater than the average market price of common stock for the period.
95