US Airways 2008 Annual Report Download - page 8
Download and view the complete annual report
Please find page 8 of the 2008 US Airways annual report below. You can navigate through the pages in the report by either clicking on the pages listed below, or by using the keyword search tool below to find specific information within the annual report.-
 1
1 -
 2
2 -
 3
3 -
 4
4 -
 5
5 -
 6
6 -
 7
7 -
 8
8 -
 9
9 -
 10
10 -
 11
11 -
 12
12 -
 13
13 -
 14
14 -
 15
15 -
 16
16 -
 17
17 -
 18
18 -
 19
19 -
20
-
21
-
22
-
23
-
24
-
25
-
26
-
27
-
28
-
29
-
30
-
31
-
32
-
33
-
34
-
35
-
36
-
37
-
38
-
39
-
40
-
41
-
42
-
43
-
44
-
45
-
46
-
47
-
48
-
49
-
50
-
51
-
52
-
53
-
54
-
55
-
56
-
57
-
58
-
59
-
60
-
61
-
62
-
63
-
64
-
65
-
66
-
67
-
68
-
69
-
70
-
71
-
72
-
73
-
74
-
75
-
76
-
77
-
78
-
79
-
80
-
81
-
82
-
83
-
84
-
85
-
86
-
87
-
88
-
89
-
90
-
91
-
92
-
93
-
94
-
95
-
96
-
97
-
98
-
99
-
100
-
101
-
102
-
103
-
104
-
105
-
106
-
107
-
108
-
109
-
110
-
111
-
112
-
113
-
114
-
115
-
116
-
117
-
118
-
119
-
120
-
121
-
122
-
123
-
124
-
125
-
126
-
127
-
128
-
129
-
130
-
131
-
132
-
133
-
134
-
135
-
136
-
137
-
138
-
139
-
140
-
141
-
142
-
143
-
144
-
145
-
146
-
147
-
148
-
149
-
150
-
151
-
152
-
153
-
154
-
155
-
156
-
157
-
158
-
159
-
160
-
161
-
162
-
163
-
164
-
165
-
166
-
167
-
168
-
169
-
170
-
171
-
172
-
173
-
174
-
175
-
176
-
177
-
178
-
179
-
180
-
181
-
182
-
183
-
184
-
185
-
186
-
187
-
188
-
189
-
190
-
191
-
192
-
193
-
194
-
195
-
196
-
197
-
198
-
199
-
200
-
201
-
202
-
203
-
204
-
205
-
206
-
207
-
208
-
209
-
210
-
211
-
212
-
213
-
214
-
215
-
216
-
217
-
218
-
219
-
220
-
221
-
222
-
223
-
224
-
225
-
226
-
227
-
228
-
229
-
230
-
231
-
232
-
233
-
234
-
235
-
236
-
237
-
238
-
239
-
240
-
241
-
242
-
243
-
244
-
245
-
246
-
247
-
248
-
249
-
250
-
251
-
252
-
253
-
254
-
255
-
256
-
257
-
258
-
259
-
260
-
261
-
262
-
263
-
264
-
265
-
266
-
267
-
268
-
269
-
270
-
271
-
272
-
273
-
274
-
275
-
276
-
277
-
278
-
279
-
280
-
281
-
282
-
283
-
284
-
285
-
286
-
287
-
288
-
289
-
290
-
291
-
292
-
293
-
294
-
295
-
296
-
297
-
298
-
299
-
300
-
301
-
302
-
303
-
304
-
305
-
306
-
307
-
308
-
309
-
310
-
311
-
312
-
313
-
314
-
315
-
316
-
317
-
318
-
319
-
320
-
321
-
322
-
323
-
324
-
325
-
326
-
327
-
328
-
329
-
330
-
331
-
332
-
333
-
334
-
335
-
336
-
337
-
338
-
339
-
340
-
341
-
342
-
343
-
344
-
345
-
346
-
347
-
348
-
349
-
350
-
351
-
352
-
353
-
354
-
355
-
356
-
357
-
358
-
359
-
360
-
361
-
362
-
363
-
364
-
365
-
366
-
367
-
368
-
369
-
370
-
371
-
372
-
373
-
374
-
375
-
376
-
377
-
378
-
379
-
380
-
381
-
382
-
383
-
384
-
385
-
386
-
387
-
388
-
389
-
390
-
391
-
392
-
393
-
394
-
395
-
396
-
397
-
398
-
399
-
400
-
401
 |
 |

Table of Contents
Airline Industry
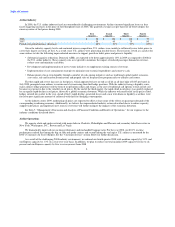
In 2008, the U.S. airline industry faced an extraordinarily challenging environment. Airlines incurred significant losses as they
faced staggering increases in the price of fuel throughout most of 2008. The quarterly average cost per barrel of oil below depicts the
runaway nature of fuel prices during 2008:
First Second Third Fourth
Quarter Quarter Quarter Quarter
2008 $ 98 $ 124 $ 118 $ 59
2007 58 65 75 90
Period over period increase (decrease) 68% 91% 57% (35%)
Given the industry capacity levels and continued intense competition, U.S. airlines were unable to sufficiently raise ticket prices to
cover their largest cost item, jet fuel. As a result, most U.S. airlines were generating sizeable losses. These factors served as a catalyst for
some airlines to take the following unprecedented measures to support growth in ticket prices and preserve liquidity:
• Substantial capacity reductions. Domestic ASMs are expected to be down approximately 10% in 2009 as compared to 2008 for
the U.S. airline industry. These capacity cuts are expected to minimize the impact of reduced passenger demand on revenue,
reduce costs and minimize cash burn.
• Development and implementation of new revenue initiatives to supplement existing sources of revenue.
• Implementation of cost containment strategies to minimize non-essential expenditures and conserve cash.
• Enhancement of near-term liquidity through a number of cash-raising initiatives such as traditional capital market issuances,
asset sales, sale and leaseback transactions and prepaid sales of frequent flyer program miles to affinity card issuers.
The then rapid and severe increases in fuel prices, which appeared to have no end as oil hit an all time high of $147 per barrel in
July 2008, prompted some airlines to contain costs by increasing their fuel hedge positions. With the industry facing a liquidity crisis,
many airlines' hedge positions took the form of no premium collars and swaps, as the cost of traditional call options to lock in fuel cost
became too expensive due to the volatility in oil prices. By the end of the third quarter, the rapid climb in oil prices was quickly replaced
by an equally rapid decline in oil prices, driven by a global economic downturn. While the industry welcomed relief in the price of fuel,
hedges entered into earlier in the year, ahead of fuel's rapid decline, generated losses and a near term drain on liquidity as airlines were
forced to post significant amounts of collateral with their fuel hedging counterparties.
As the industry enters 2009, moderating oil prices are expected to offset at least some of the effects on passenger demand of the
corresponding weakening economy. Additionally, we believe the unprecedented industry actions described above to reduce capacity,
support ticket prices and implement new sources of revenue will further mitigate the impacts of the economic downturn.
See Item 7, "Management's Discussion and Analysis of Financial Condition and Results of Operations," for our response to the
industry conditions discussed above.
Airline Operations
We operate a hub-and-spoke network with major hubs in Charlotte, Philadelphia and Phoenix and secondary hubs/focus cities in
New York, Washington, D.C., Boston and Las Vegas.
We dramatically improved our on-time performance and mishandled baggage ratio. For the year 2008, our 80.1% on-time
performance ranked first among the big six hub and spoke carriers and second among the ten largest U.S. airlines as measured by the
DOT's Consumer Air Travel Report. See the "Customer Service" section below for further discussion.
As a result of the challenging 2008 industry environment, we reduced our fourth quarter 2008 total mainline capacity by 5.9% and
our Express capacity by 1.3% on a year-over-year basis. In addition, we plan to reduce our total mainline 2009 capacity by four to six
percent and our Express capacity by five to seven percent from 2008
6