US Airways 2008 Annual Report Download - page 112
Download and view the complete annual report
Please find page 112 of the 2008 US Airways annual report below. You can navigate through the pages in the report by either clicking on the pages listed below, or by using the keyword search tool below to find specific information within the annual report.-
 1
1 -
2
-
3
-
4
-
5
-
6
-
7
-
8
-
9
-
10
-
11
-
12
-
13
-
14
-
15
-
16
-
17
-
18
-
19
-
20
-
21
-
22
-
23
-
24
-
25
-
26
-
27
-
28
-
29
-
30
-
31
-
32
-
33
-
34
-
35
-
36
-
37
-
38
-
39
-
40
-
41
-
42
-
43
-
44
-
45
-
46
-
47
-
48
-
49
-
50
-
51
-
52
-
53
-
54
-
55
-
56
-
57
-
58
-
59
-
60
-
61
-
62
-
63
-
64
-
65
-
66
-
67
-
68
-
69
-
70
-
71
-
72
-
73
-
74
-
75
-
76
-
77
-
78
-
79
-
80
-
81
-
82
-
83
-
84
-
85
-
86
-
87
-
88
-
89
-
90
-
91
-
92
-
93
-
94
-
95
-
96
-
97
-
98
-
99
-
100
-
101
-
 102
102 -
 103
103 -
 104
104 -
 105
105 -
 106
106 -
 107
107 -
 108
108 -
 109
109 -
 110
110 -
 111
111 -
 112
112 -
 113
113 -
 114
114 -
 115
115 -
 116
116 -
 117
117 -
 118
118 -
 119
119 -
 120
120 -
 121
121 -
 122
122 -
123
-
124
-
125
-
126
-
127
-
128
-
129
-
130
-
131
-
132
-
133
-
134
-
135
-
136
-
137
-
138
-
139
-
140
-
141
-
142
-
143
-
144
-
145
-
146
-
147
-
148
-
149
-
150
-
151
-
152
-
153
-
154
-
155
-
156
-
157
-
158
-
159
-
160
-
161
-
162
-
163
-
164
-
165
-
166
-
167
-
168
-
169
-
170
-
171
-
172
-
173
-
174
-
175
-
176
-
177
-
178
-
179
-
180
-
181
-
182
-
183
-
184
-
185
-
186
-
187
-
188
-
189
-
190
-
191
-
192
-
193
-
194
-
195
-
196
-
197
-
198
-
199
-
200
-
201
-
202
-
203
-
204
-
205
-
206
-
207
-
208
-
209
-
210
-
211
-
212
-
213
-
214
-
215
-
216
-
217
-
218
-
219
-
220
-
221
-
222
-
223
-
224
-
225
-
226
-
227
-
228
-
229
-
230
-
231
-
232
-
233
-
234
-
235
-
236
-
237
-
238
-
239
-
240
-
241
-
242
-
243
-
244
-
245
-
246
-
247
-
248
-
249
-
250
-
251
-
252
-
253
-
254
-
255
-
256
-
257
-
258
-
259
-
260
-
261
-
262
-
263
-
264
-
265
-
266
-
267
-
268
-
269
-
270
-
271
-
272
-
273
-
274
-
275
-
276
-
277
-
278
-
279
-
280
-
281
-
282
-
283
-
284
-
285
-
286
-
287
-
288
-
289
-
290
-
291
-
292
-
293
-
294
-
295
-
296
-
297
-
298
-
299
-
300
-
301
-
302
-
303
-
304
-
305
-
306
-
307
-
308
-
309
-
310
-
311
-
312
-
313
-
314
-
315
-
316
-
317
-
318
-
319
-
320
-
321
-
322
-
323
-
324
-
325
-
326
-
327
-
328
-
329
-
330
-
331
-
332
-
333
-
334
-
335
-
336
-
337
-
338
-
339
-
340
-
341
-
342
-
343
-
344
-
345
-
346
-
347
-
348
-
349
-
350
-
351
-
352
-
353
-
354
-
355
-
356
-
357
-
358
-
359
-
360
-
361
-
362
-
363
-
364
-
365
-
366
-
367
-
368
-
369
-
370
-
371
-
372
-
373
-
374
-
375
-
376
-
377
-
378
-
379
-
380
-
381
-
382
-
383
-
384
-
385
-
386
-
387
-
388
-
389
-
390
-
391
-
392
-
393
-
394
-
395
-
396
-
397
-
398
-
399
-
400
-
401
 |
 |

Table of Contents
US Airways Group, Inc.
Notes to Consolidated Financial Statements — (Continued)
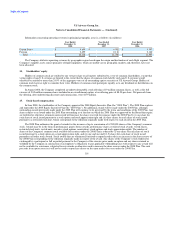
(2) For the year ended December 31, 2007, the Company recognized a $5 million curtailment gain related to the elimination of a social
security supplemental benefit as a result of the federally mandated change in the pilot retirement age from age 60 to 65.
Defined benefit plans are measured as of December 31, 2008 and 2007. As described in Note 1(s), the Company adopted the
measurement provisions of SFAS No. 158 on January 1, 2008. The change in the Company's other postretirement benefit obligation
reflects a $4 million reduction for the adoption of SFAS No. 158 which includes $6 million of benefit payments, offset by $2 million of
net periodic benefit costs for the period between the measurement date utilized in 2007, September 30, and the beginning of 2008. The
$2 million of net periodic benefit costs was recorded as an adjustment to accumulated deficit.
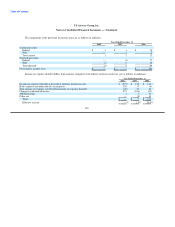
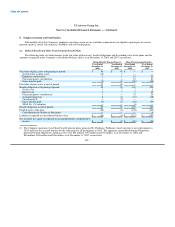
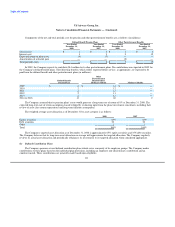
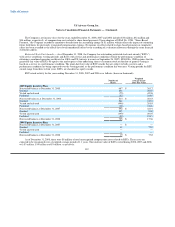
The following table presents the weighted average assumptions used to determine benefit obligations:
Defined Benefit Pension Plans Other Postretirement Benefits
Year Ended Year Ended Year Ended Year Ended
December 31, December 31, December 31, December 31,
2008 2007 2008 2007
Discount rate 5.5% 6% 5.98% 5.94%
Rate of compensation increase 4% 4% — —
As of December 31, 2008 and 2007, the Company discounted its pension obligations based on the current rates earned on high
quality Aa rated long-term bonds.
The Company assumed discount rates for measuring its other postretirement benefit obligations, based on a hypothetical portfolio of
high quality publicly traded U.S. bonds (Aa rated, non-callable or callable with make-whole provisions), for which the timing and cash
outflows approximate the estimated benefit payments of the other postretirement benefit plans.
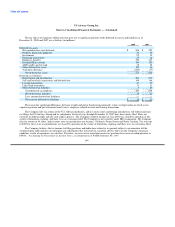
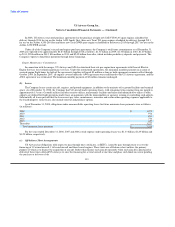
As of December 31, 2008, the assumed health care cost trend rates are 9% in 2009 and 8% in 2010, decreasing to 5.5% in 2015 and
thereafter. As of September 30, 2007, the assumed health care cost trend rates are 10% in 2008 and 9% in 2009, decreasing to 5.5% in
2013 and thereafter. The assumed health care cost trend rates could have a significant effect on amounts reported for retiree health care
plans. A one-percentage point change in the health care cost trend rates would have the following effects on other postretirement benefits
as of December 31, 2008 (in millions):
1% Increase 1% Decrease
Effect on total service and interest costs $ 1 $ (1)
Effect on postretirement benefit obligation 6 (5)
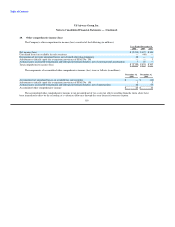
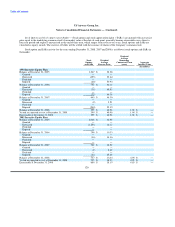
Weighted average assumptions used to determine net periodic benefit cost were as follows:
Defined Benefit Pension Plans Other Postretirement Benefits
Year Ended Year Ended Year Ended Year Ended
December 31, December 31, December 31, December 31,
2008 2007 2008 2007
Discount rate 6% 5.75% 5.94% 5.67%
Expected return on plan assets 8% 8% — —
Rate of compensation increase 4% 4% — —
110