US Airways 2008 Annual Report Download - page 106
Download and view the complete annual report
Please find page 106 of the 2008 US Airways annual report below. You can navigate through the pages in the report by either clicking on the pages listed below, or by using the keyword search tool below to find specific information within the annual report.-
 1
1 -
2
-
3
-
4
-
5
-
6
-
7
-
8
-
9
-
10
-
11
-
12
-
13
-
14
-
15
-
16
-
17
-
18
-
19
-
20
-
21
-
22
-
23
-
24
-
25
-
26
-
27
-
28
-
29
-
30
-
31
-
32
-
33
-
34
-
35
-
36
-
37
-
38
-
39
-
40
-
41
-
42
-
43
-
44
-
45
-
46
-
47
-
48
-
49
-
50
-
51
-
52
-
53
-
54
-
55
-
56
-
57
-
58
-
59
-
60
-
61
-
62
-
63
-
64
-
65
-
66
-
67
-
68
-
69
-
70
-
71
-
72
-
73
-
74
-
75
-
76
-
77
-
78
-
79
-
80
-
81
-
82
-
83
-
84
-
85
-
86
-
87
-
88
-
89
-
90
-
91
-
92
-
93
-
94
-
95
-
 96
96 -
 97
97 -
 98
98 -
 99
99 -
 100
100 -
 101
101 -
 102
102 -
 103
103 -
 104
104 -
 105
105 -
 106
106 -
 107
107 -
 108
108 -
 109
109 -
 110
110 -
 111
111 -
 112
112 -
 113
113 -
 114
114 -
 115
115 -
 116
116 -
117
-
118
-
119
-
120
-
121
-
122
-
123
-
124
-
125
-
126
-
127
-
128
-
129
-
130
-
131
-
132
-
133
-
134
-
135
-
136
-
137
-
138
-
139
-
140
-
141
-
142
-
143
-
144
-
145
-
146
-
147
-
148
-
149
-
150
-
151
-
152
-
153
-
154
-
155
-
156
-
157
-
158
-
159
-
160
-
161
-
162
-
163
-
164
-
165
-
166
-
167
-
168
-
169
-
170
-
171
-
172
-
173
-
174
-
175
-
176
-
177
-
178
-
179
-
180
-
181
-
182
-
183
-
184
-
185
-
186
-
187
-
188
-
189
-
190
-
191
-
192
-
193
-
194
-
195
-
196
-
197
-
198
-
199
-
200
-
201
-
202
-
203
-
204
-
205
-
206
-
207
-
208
-
209
-
210
-
211
-
212
-
213
-
214
-
215
-
216
-
217
-
218
-
219
-
220
-
221
-
222
-
223
-
224
-
225
-
226
-
227
-
228
-
229
-
230
-
231
-
232
-
233
-
234
-
235
-
236
-
237
-
238
-
239
-
240
-
241
-
242
-
243
-
244
-
245
-
246
-
247
-
248
-
249
-
250
-
251
-
252
-
253
-
254
-
255
-
256
-
257
-
258
-
259
-
260
-
261
-
262
-
263
-
264
-
265
-
266
-
267
-
268
-
269
-
270
-
271
-
272
-
273
-
274
-
275
-
276
-
277
-
278
-
279
-
280
-
281
-
282
-
283
-
284
-
285
-
286
-
287
-
288
-
289
-
290
-
291
-
292
-
293
-
294
-
295
-
296
-
297
-
298
-
299
-
300
-
301
-
302
-
303
-
304
-
305
-
306
-
307
-
308
-
309
-
310
-
311
-
312
-
313
-
314
-
315
-
316
-
317
-
318
-
319
-
320
-
321
-
322
-
323
-
324
-
325
-
326
-
327
-
328
-
329
-
330
-
331
-
332
-
333
-
334
-
335
-
336
-
337
-
338
-
339
-
340
-
341
-
342
-
343
-
344
-
345
-
346
-
347
-
348
-
349
-
350
-
351
-
352
-
353
-
354
-
355
-
356
-
357
-
358
-
359
-
360
-
361
-
362
-
363
-
364
-
365
-
366
-
367
-
368
-
369
-
370
-
371
-
372
-
373
-
374
-
375
-
376
-
377
-
378
-
379
-
380
-
381
-
382
-
383
-
384
-
385
-
386
-
387
-
388
-
389
-
390
-
391
-
392
-
393
-
394
-
395
-
396
-
397
-
398
-
399
-
400
-
401
 |
 |
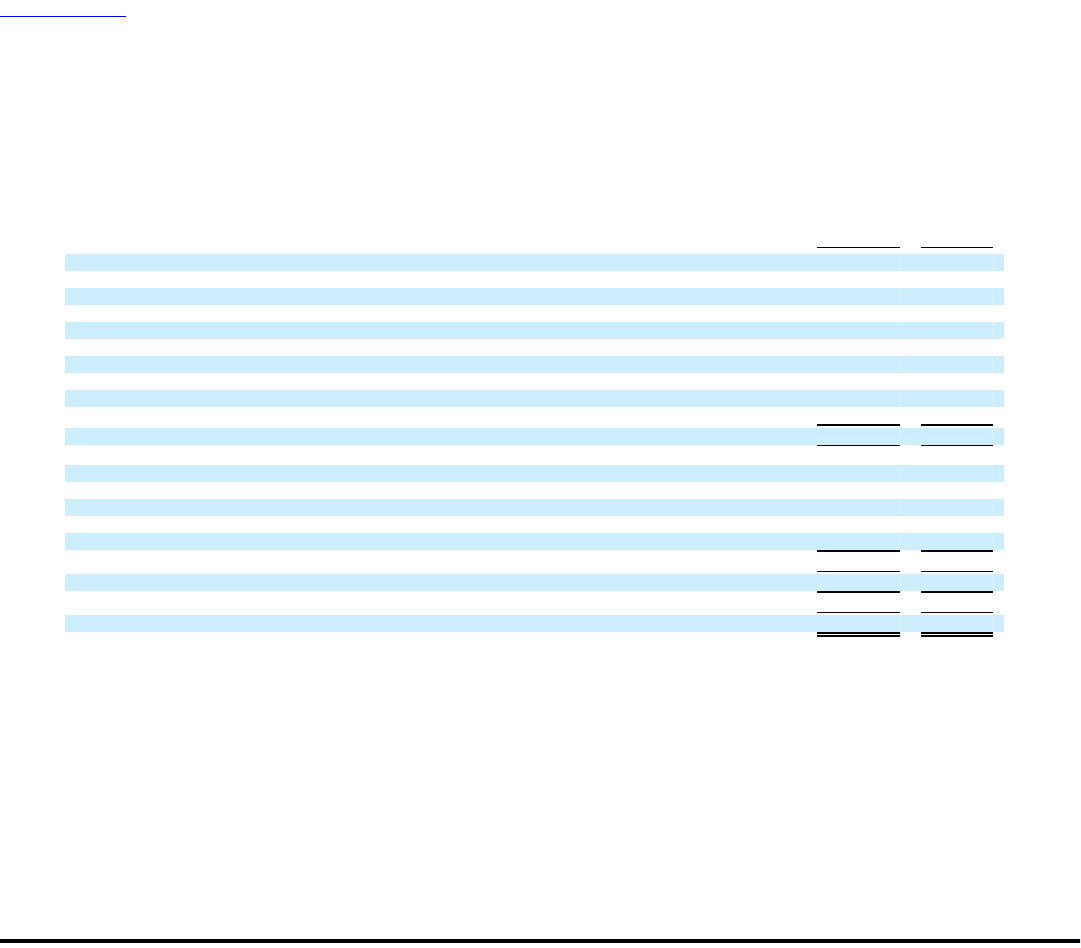
Table of Contents
US Airways Group, Inc.
Notes to Consolidated Financial Statements — (Continued)
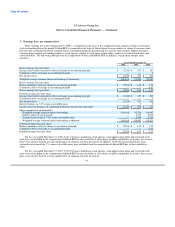
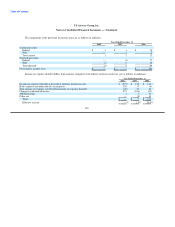
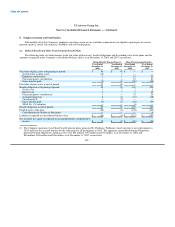
The tax effects of temporary differences that give rise to significant portions of the deferred tax assets and liabilities as of
December 31, 2008 and 2007 are as follows (in millions):
2008 2007
Deferred tax assets:
Net operating loss carryforwards $ 546 $ 282
Property, plant and equipment 22 22
Investments 95 19
Financing transactions 25 18
Employee benefits 352 347
Dividend Miles awards 144 153
AMT credit carryforward 38 38
Other deferred tax assets 199 16
Valuation allowance (650) (77)
Net deferred tax assets 771 818
Deferred tax liabilities:
Depreciation and amortization 563 519
Sale and leaseback transactions and deferred rent 144 146
Leasing transactions 47 59
Long-lived intangibles 31 31
Other deferred tax liabilities 5 84
Total deferred tax liabilities 790 839
Net deferred tax liabilities 19 21
Less: current deferred tax liabilities — —
Non-current deferred tax liabilities $ 19 $ 21
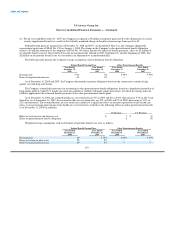
The reason for significant differences between taxable and pretax book income primarily relates to depreciation on fixed assets,
employee pension and postretirement benefit costs, employee-related accruals and leasing transactions.
The Company files tax returns in the U.S. federal jurisdiction, and in various states and foreign jurisdictions. All federal and state
tax filings for US Airways Group and its subsidiaries for fiscal years through December 31, 2007 have been timely filed. There are
currently no federal audits and one state audit in process. The Company's federal income tax year 2004 was closed by operation of the
statute of limitations expiring, and there were no extensions filed. The Company is not currently under IRS examination. The Company
files tax returns in 44 states, and its major state tax jurisdictions are Arizona, California, Pennsylvania and North Carolina. Tax years up
to 2003 for these state tax jurisdictions are closed by operation of the statute of limitations expiring, and there were no extensions filed.
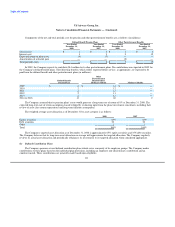
The Company believes that its income tax filing positions and deductions related to tax periods subject to examination will be
sustained upon audit and does not anticipate any adjustments that will result in a material adverse effect on the Company's financial
condition, results of operations, or cash flow. Therefore, no reserves for uncertain income tax positions have been recorded pursuant to
FIN 48, "Accounting for Uncertainty in Income Taxes, an interpretation of FASB Statement No. 109."
104