US Airways 2008 Annual Report Download - page 49
Download and view the complete annual report
Please find page 49 of the 2008 US Airways annual report below. You can navigate through the pages in the report by either clicking on the pages listed below, or by using the keyword search tool below to find specific information within the annual report.-
 1
1 -
2
-
3
-
4
-
5
-
6
-
7
-
8
-
9
-
10
-
11
-
12
-
13
-
14
-
15
-
16
-
17
-
18
-
19
-
20
-
21
-
22
-
23
-
24
-
25
-
26
-
27
-
28
-
29
-
30
-
31
-
32
-
33
-
34
-
35
-
36
-
37
-
38
-
 39
39 -
 40
40 -
 41
41 -
 42
42 -
 43
43 -
 44
44 -
 45
45 -
 46
46 -
 47
47 -
 48
48 -
 49
49 -
 50
50 -
 51
51 -
 52
52 -
 53
53 -
 54
54 -
 55
55 -
 56
56 -
 57
57 -
 58
58 -
 59
59 -
60
-
61
-
62
-
63
-
64
-
65
-
66
-
67
-
68
-
69
-
70
-
71
-
72
-
73
-
74
-
75
-
76
-
77
-
78
-
79
-
80
-
81
-
82
-
83
-
84
-
85
-
86
-
87
-
88
-
89
-
90
-
91
-
92
-
93
-
94
-
95
-
96
-
97
-
98
-
99
-
100
-
101
-
102
-
103
-
104
-
105
-
106
-
107
-
108
-
109
-
110
-
111
-
112
-
113
-
114
-
115
-
116
-
117
-
118
-
119
-
120
-
121
-
122
-
123
-
124
-
125
-
126
-
127
-
128
-
129
-
130
-
131
-
132
-
133
-
134
-
135
-
136
-
137
-
138
-
139
-
140
-
141
-
142
-
143
-
144
-
145
-
146
-
147
-
148
-
149
-
150
-
151
-
152
-
153
-
154
-
155
-
156
-
157
-
158
-
159
-
160
-
161
-
162
-
163
-
164
-
165
-
166
-
167
-
168
-
169
-
170
-
171
-
172
-
173
-
174
-
175
-
176
-
177
-
178
-
179
-
180
-
181
-
182
-
183
-
184
-
185
-
186
-
187
-
188
-
189
-
190
-
191
-
192
-
193
-
194
-
195
-
196
-
197
-
198
-
199
-
200
-
201
-
202
-
203
-
204
-
205
-
206
-
207
-
208
-
209
-
210
-
211
-
212
-
213
-
214
-
215
-
216
-
217
-
218
-
219
-
220
-
221
-
222
-
223
-
224
-
225
-
226
-
227
-
228
-
229
-
230
-
231
-
232
-
233
-
234
-
235
-
236
-
237
-
238
-
239
-
240
-
241
-
242
-
243
-
244
-
245
-
246
-
247
-
248
-
249
-
250
-
251
-
252
-
253
-
254
-
255
-
256
-
257
-
258
-
259
-
260
-
261
-
262
-
263
-
264
-
265
-
266
-
267
-
268
-
269
-
270
-
271
-
272
-
273
-
274
-
275
-
276
-
277
-
278
-
279
-
280
-
281
-
282
-
283
-
284
-
285
-
286
-
287
-
288
-
289
-
290
-
291
-
292
-
293
-
294
-
295
-
296
-
297
-
298
-
299
-
300
-
301
-
302
-
303
-
304
-
305
-
306
-
307
-
308
-
309
-
310
-
311
-
312
-
313
-
314
-
315
-
316
-
317
-
318
-
319
-
320
-
321
-
322
-
323
-
324
-
325
-
326
-
327
-
328
-
329
-
330
-
331
-
332
-
333
-
334
-
335
-
336
-
337
-
338
-
339
-
340
-
341
-
342
-
343
-
344
-
345
-
346
-
347
-
348
-
349
-
350
-
351
-
352
-
353
-
354
-
355
-
356
-
357
-
358
-
359
-
360
-
361
-
362
-
363
-
364
-
365
-
366
-
367
-
368
-
369
-
370
-
371
-
372
-
373
-
374
-
375
-
376
-
377
-
378
-
379
-
380
-
381
-
382
-
383
-
384
-
385
-
386
-
387
-
388
-
389
-
390
-
391
-
392
-
393
-
394
-
395
-
396
-
397
-
398
-
399
-
400
-
401
 |
 |

Table of Contents
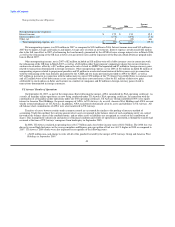
Cargo revenues were $138 million in 2007, a decrease of $15 million from the 2006 period due to decreases in domestic mail and
freight volumes. Other revenues were $729 million in 2007, an increase of $35 million from the 2006 period. The increase in other
revenues was primarily driven by an increase in revenue associated with higher fuel sales to pro-rate carriers through MSC.
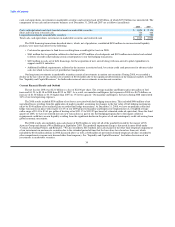
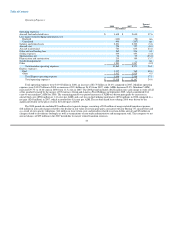
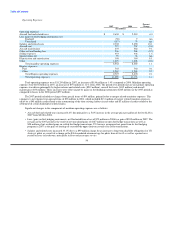
Operating Expenses:
Percent
2007 2006 Change
(In millions)
Operating expenses:
Aircraft fuel and related taxes $ 2,630 $ 2,518 4.4
Loss (gain) on fuel hedging instruments, net:
Realized (58) 9 nm
Unrealized (187) 70 nm
Salaries and related costs 2,302 2,090 10.1
Aircraft rent 727 732 (0.6)
Aircraft maintenance 635 582 9.1
Other rent and landing fees 536 568 (5.7)
Selling expenses 453 446 1.6
Special items, net 99 27 nm
Depreciation and amortization 189 175 8.2
Other 1,247 1,223 2.0
Total mainline operating expenses 8,573 8,440 1.6
Express expenses:
Fuel 765 764 0.1
Other 1,829 1,795 1.9
Total Express operating expenses 2,594 2,559 1.4
Total operating expenses $ 11,167 $ 10,999 1.5
Total operating expenses were $11.17 billion in 2007, an increase of $168 million or 1.5% compared to 2006. Mainline operating
expenses were $8.57 billion in 2007, an increase of $133 million or 1.6% from 2006, while ASMs decreased 1.5%. Mainline CASM
increased 3.1% to 11.3 cents in 2007 from 10.96 cents in 2006. The period over period increase in CASM was driven principally by
higher salaries and related costs ($212 million or 0.32 cents per ASM), due primarily to increased headcount associated with our
operational improvement plan and a $99 million charge to increase our obligation for long-term disability as a result of a change in the
FAA mandated retirement age for certain pilots, and an increase in aircraft fuel costs ($112 million or 0.2 cents per ASM), due to a 5.8%
increase in the average price per gallon of fuel in 2007. These increases were offset in part by gains on fuel hedging instruments
($245 million) in the 2007 period as compared to losses in the 2006 period ($79 million), which accounted for 0.42 cents per ASM.
The 2007 period also included net charges from special items of $99 million, primarily due to merger related transition expenses.
This compares to net charges from special items of $27 million in 2006, which included $131 million of merger related transition
expenses, offset by a $90 million credit related to the restructuring of the then existing Airbus aircraft order and $14 million of credits
related to the settlement of certain bankruptcy-related claims.
47