US Airways 2008 Annual Report Download - page 113
Download and view the complete annual report
Please find page 113 of the 2008 US Airways annual report below. You can navigate through the pages in the report by either clicking on the pages listed below, or by using the keyword search tool below to find specific information within the annual report.-
 1
1 -
2
-
3
-
4
-
5
-
6
-
7
-
8
-
9
-
10
-
11
-
12
-
13
-
14
-
15
-
16
-
17
-
18
-
19
-
20
-
21
-
22
-
23
-
24
-
25
-
26
-
27
-
28
-
29
-
30
-
31
-
32
-
33
-
34
-
35
-
36
-
37
-
38
-
39
-
40
-
41
-
42
-
43
-
44
-
45
-
46
-
47
-
48
-
49
-
50
-
51
-
52
-
53
-
54
-
55
-
56
-
57
-
58
-
59
-
60
-
61
-
62
-
63
-
64
-
65
-
66
-
67
-
68
-
69
-
70
-
71
-
72
-
73
-
74
-
75
-
76
-
77
-
78
-
79
-
80
-
81
-
82
-
83
-
84
-
85
-
86
-
87
-
88
-
89
-
90
-
91
-
92
-
93
-
94
-
95
-
96
-
97
-
98
-
99
-
100
-
101
-
102
-
 103
103 -
 104
104 -
 105
105 -
 106
106 -
 107
107 -
 108
108 -
 109
109 -
 110
110 -
 111
111 -
 112
112 -
 113
113 -
 114
114 -
 115
115 -
 116
116 -
 117
117 -
 118
118 -
 119
119 -
 120
120 -
 121
121 -
 122
122 -
 123
123 -
124
-
125
-
126
-
127
-
128
-
129
-
130
-
131
-
132
-
133
-
134
-
135
-
136
-
137
-
138
-
139
-
140
-
141
-
142
-
143
-
144
-
145
-
146
-
147
-
148
-
149
-
150
-
151
-
152
-
153
-
154
-
155
-
156
-
157
-
158
-
159
-
160
-
161
-
162
-
163
-
164
-
165
-
166
-
167
-
168
-
169
-
170
-
171
-
172
-
173
-
174
-
175
-
176
-
177
-
178
-
179
-
180
-
181
-
182
-
183
-
184
-
185
-
186
-
187
-
188
-
189
-
190
-
191
-
192
-
193
-
194
-
195
-
196
-
197
-
198
-
199
-
200
-
201
-
202
-
203
-
204
-
205
-
206
-
207
-
208
-
209
-
210
-
211
-
212
-
213
-
214
-
215
-
216
-
217
-
218
-
219
-
220
-
221
-
222
-
223
-
224
-
225
-
226
-
227
-
228
-
229
-
230
-
231
-
232
-
233
-
234
-
235
-
236
-
237
-
238
-
239
-
240
-
241
-
242
-
243
-
244
-
245
-
246
-
247
-
248
-
249
-
250
-
251
-
252
-
253
-
254
-
255
-
256
-
257
-
258
-
259
-
260
-
261
-
262
-
263
-
264
-
265
-
266
-
267
-
268
-
269
-
270
-
271
-
272
-
273
-
274
-
275
-
276
-
277
-
278
-
279
-
280
-
281
-
282
-
283
-
284
-
285
-
286
-
287
-
288
-
289
-
290
-
291
-
292
-
293
-
294
-
295
-
296
-
297
-
298
-
299
-
300
-
301
-
302
-
303
-
304
-
305
-
306
-
307
-
308
-
309
-
310
-
311
-
312
-
313
-
314
-
315
-
316
-
317
-
318
-
319
-
320
-
321
-
322
-
323
-
324
-
325
-
326
-
327
-
328
-
329
-
330
-
331
-
332
-
333
-
334
-
335
-
336
-
337
-
338
-
339
-
340
-
341
-
342
-
343
-
344
-
345
-
346
-
347
-
348
-
349
-
350
-
351
-
352
-
353
-
354
-
355
-
356
-
357
-
358
-
359
-
360
-
361
-
362
-
363
-
364
-
365
-
366
-
367
-
368
-
369
-
370
-
371
-
372
-
373
-
374
-
375
-
376
-
377
-
378
-
379
-
380
-
381
-
382
-
383
-
384
-
385
-
386
-
387
-
388
-
389
-
390
-
391
-
392
-
393
-
394
-
395
-
396
-
397
-
398
-
399
-
400
-
401
 |
 |

Table of Contents
US Airways Group, Inc.
Notes to Consolidated Financial Statements — (Continued)
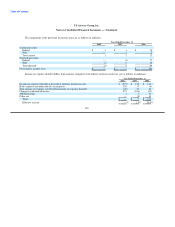
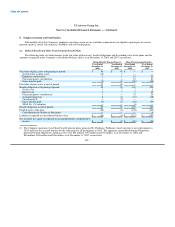
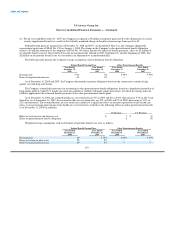
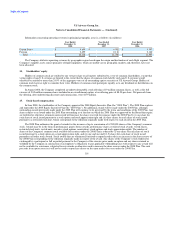
Components of the net and total periodic cost for pension and other postretirement benefits are as follows (in millions):
Defined Benefit Pension Plans Other Postretirement Benefits
Year Ended Year Ended Year Ended Year Ended
December 31, December 31, December 31, December 31,
2008 2007 2008 2007
Service cost $ 1 $ 2 $ 2 $ 3
Interest cost 3 3 9 12
Expected return on plan assets (4) (3) — —
Amortization of actuarial gain — — (2) —
Total periodic costs $ — $ 2 $ 9 $ 15
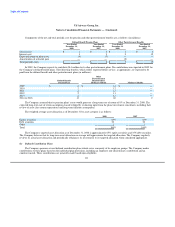
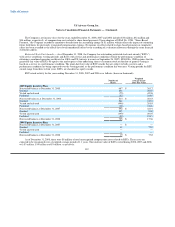
In 2009, the Company expects to contribute $14 million to its other postretirement plans. No contributions are expected in 2009 for
the Company's defined benefit plans. The following benefits, which reflect expected future service, as appropriate, are expected to be
paid from the defined benefit and other postretirement plans (in millions):
Other
Postretirement
Defined Benefit Benefits before
Pension Plans Medicare Subsidy Medicare Subsidy
2009 $ 2 $ 14 $ —
2010 2 12 —
2011 2 12 —
2012 2 11 —
2013 2 12 —
2014 to 2018 13 60 2
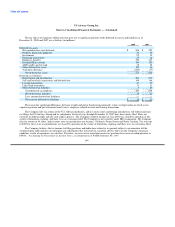
The Company assumed that its pension plans' assets would generate a long-term rate of return of 8% at December 31, 2008. The
expected long-term rate of return assumption was developed by evaluating input from the plans' investment consultants, including their
review of asset class return expectations and long-term inflation assumptions.
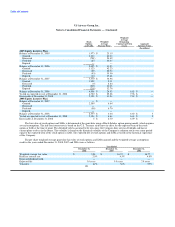
The weighted average asset allocation as of December 31 by asset category is as follows:
2008 2007
Equity securities 69% 69%
Debt securities 30 30
Other 1 1
Total 100% 100%
The Company's targeted asset allocation as of December 31, 2008 is approximately 65% equity securities and 35% debt securities.
The Company believes that its long-term asset allocation on average will approximate the targeted allocation. The Company regularly
reviews its actual asset allocation and periodically rebalances its investments to its targeted allocation when considered appropriate.
(b) Defined Contribution Plans
The Company sponsors several defined contribution plans which cover a majority of its employee groups. The Company makes
contributions to these plans based on the individual plan provisions, including an employer non-discretionary contribution and an
employer match. These contributions are generally made based upon eligibility,
111