US Airways 2008 Annual Report Download - page 108
Download and view the complete annual report
Please find page 108 of the 2008 US Airways annual report below. You can navigate through the pages in the report by either clicking on the pages listed below, or by using the keyword search tool below to find specific information within the annual report.-
 1
1 -
2
-
3
-
4
-
5
-
6
-
7
-
8
-
9
-
10
-
11
-
12
-
13
-
14
-
15
-
16
-
17
-
18
-
19
-
20
-
21
-
22
-
23
-
24
-
25
-
26
-
27
-
28
-
29
-
30
-
31
-
32
-
33
-
34
-
35
-
36
-
37
-
38
-
39
-
40
-
41
-
42
-
43
-
44
-
45
-
46
-
47
-
48
-
49
-
50
-
51
-
52
-
53
-
54
-
55
-
56
-
57
-
58
-
59
-
60
-
61
-
62
-
63
-
64
-
65
-
66
-
67
-
68
-
69
-
70
-
71
-
72
-
73
-
74
-
75
-
76
-
77
-
78
-
79
-
80
-
81
-
82
-
83
-
84
-
85
-
86
-
87
-
88
-
89
-
90
-
91
-
92
-
93
-
94
-
95
-
96
-
97
-
 98
98 -
 99
99 -
 100
100 -
 101
101 -
 102
102 -
 103
103 -
 104
104 -
 105
105 -
 106
106 -
 107
107 -
 108
108 -
 109
109 -
 110
110 -
 111
111 -
 112
112 -
 113
113 -
 114
114 -
 115
115 -
 116
116 -
 117
117 -
 118
118 -
119
-
120
-
121
-
122
-
123
-
124
-
125
-
126
-
127
-
128
-
129
-
130
-
131
-
132
-
133
-
134
-
135
-
136
-
137
-
138
-
139
-
140
-
141
-
142
-
143
-
144
-
145
-
146
-
147
-
148
-
149
-
150
-
151
-
152
-
153
-
154
-
155
-
156
-
157
-
158
-
159
-
160
-
161
-
162
-
163
-
164
-
165
-
166
-
167
-
168
-
169
-
170
-
171
-
172
-
173
-
174
-
175
-
176
-
177
-
178
-
179
-
180
-
181
-
182
-
183
-
184
-
185
-
186
-
187
-
188
-
189
-
190
-
191
-
192
-
193
-
194
-
195
-
196
-
197
-
198
-
199
-
200
-
201
-
202
-
203
-
204
-
205
-
206
-
207
-
208
-
209
-
210
-
211
-
212
-
213
-
214
-
215
-
216
-
217
-
218
-
219
-
220
-
221
-
222
-
223
-
224
-
225
-
226
-
227
-
228
-
229
-
230
-
231
-
232
-
233
-
234
-
235
-
236
-
237
-
238
-
239
-
240
-
241
-
242
-
243
-
244
-
245
-
246
-
247
-
248
-
249
-
250
-
251
-
252
-
253
-
254
-
255
-
256
-
257
-
258
-
259
-
260
-
261
-
262
-
263
-
264
-
265
-
266
-
267
-
268
-
269
-
270
-
271
-
272
-
273
-
274
-
275
-
276
-
277
-
278
-
279
-
280
-
281
-
282
-
283
-
284
-
285
-
286
-
287
-
288
-
289
-
290
-
291
-
292
-
293
-
294
-
295
-
296
-
297
-
298
-
299
-
300
-
301
-
302
-
303
-
304
-
305
-
306
-
307
-
308
-
309
-
310
-
311
-
312
-
313
-
314
-
315
-
316
-
317
-
318
-
319
-
320
-
321
-
322
-
323
-
324
-
325
-
326
-
327
-
328
-
329
-
330
-
331
-
332
-
333
-
334
-
335
-
336
-
337
-
338
-
339
-
340
-
341
-
342
-
343
-
344
-
345
-
346
-
347
-
348
-
349
-
350
-
351
-
352
-
353
-
354
-
355
-
356
-
357
-
358
-
359
-
360
-
361
-
362
-
363
-
364
-
365
-
366
-
367
-
368
-
369
-
370
-
371
-
372
-
373
-
374
-
375
-
376
-
377
-
378
-
379
-
380
-
381
-
382
-
383
-
384
-
385
-
386
-
387
-
388
-
389
-
390
-
391
-
392
-
393
-
394
-
395
-
396
-
397
-
398
-
399
-
400
-
401
 |
 |

Table of Contents
US Airways Group, Inc.
Notes to Consolidated Financial Statements — (Continued)
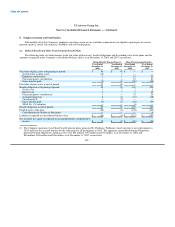
of credit to certain counterparties in lieu of cash. At December 31, 2008, $185 million related to letters of credit collateralizing certain
counterparties to the Company's fuel hedging transactions is included in short-term restricted cash. In addition, at December 31, 2008, the
Company had $276 million in cash deposits held by counterparties to its fuel hedging transactions. Since the third quarter of 2008, the
Company has not entered into any new transactions as part of its fuel hedging program due to the impact collateral requirements could
have on its liquidity resulting from the significant decline in the price of oil and counterparty credit risk arising from global economic
uncertainty.
Further declines in heating oil prices would result in additional collateral requirements with the Company's counterparties,
unrealized losses on its existing fuel hedging derivative instruments and realized losses at the time of settlement of these fuel hedging
derivative instruments.
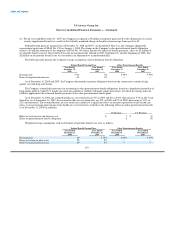
Cash, Cash Equivalents and Investments in Marketable Securities
The Company invests available cash in money market securities and highly liquid debt instruments.
As of December 31, 2008, the Company held auction rate securities totaling $411 million at par value, which are classified as
available for sale securities and noncurrent assets on the Company's consolidated balance sheets. Contractual maturities for these auction
rate securities range from eight to 44 years, with 62% of the Company's portfolio maturing within the next ten years, 10% maturing
within the next 20 years, 16% maturing within the next 30 years and 12% maturing thereafter through 2052. The interest rates are reset
approximately every 28 days, except one security for which the auction process is currently suspended. Current yields range from 1.76%
to 6.08%. With the liquidity issues experienced in the global credit and capital markets, all of the Company's auction rate securities have
experienced failed auctions since August 2007. The estimated fair value of these auction rate securities no longer approximates par value.
However, the Company has not experienced any defaults and continues to earn and receive interest at the maximum contractual rates. See
Note 7 for discussion on how the Company determines the fair value of its investments in auction rate securities.
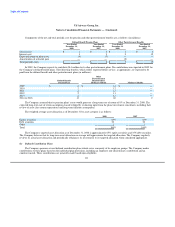
At December 31, 2007, the $411 million par value auction rate securities had a fair value of $353 million, a $58 million decline
from par. Of this decline in fair value, $48 million was deemed temporary and an unrealized loss in this amount was recorded to other
comprehensive income. The Company concluded $10 million of the decline was an other than temporary impairment as a single security
with subprime exposure experienced a severe decline in fair value during the period. Accordingly, the $10 million impairment charge was
recorded to other nonoperating expense, net in the fourth quarter of 2007.
At December 31, 2008, the fair value of the Company's auction rate securities was $187 million, representing a decline in fair value
of $166 million from December 31, 2007. The decline in fair value was caused by the significant deterioration in the financial markets in
2008. The Company concluded that the 2008 decline in fair value of $166 million as well as the previously deemed temporary declines
recorded to other comprehensive income of $48 million were now other than temporary. The Company's conclusion for the other than
temporary impairment was due to the length of time and extent to which the fair value has been less than cost for certain securities. All of
these securities have experienced failed auctions for a period greater than one year, and there has been no recovery in their fair value.
Accordingly, the Company recorded $214 million in impairment charges in other nonoperating expense, net related to the other than
temporary impairment of its auction rate securities. The Company continues to monitor the market for auction rate securities and consider
its impact (if any) on the fair value of its investments. If the current market conditions deteriorate further, the Company may be required
to record additional impairment charges in other nonoperating expense, net in future periods.
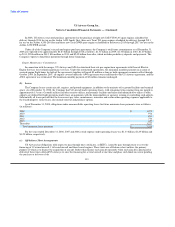
Accounts Receivable
As of December 31, 2008, most of the Company's receivables related to tickets sold to individual passengers through the use of
major credit cards or to tickets sold by other airlines and used by passengers on US Airways or its
106