US Airways 2008 Annual Report Download - page 72
Download and view the complete annual report
Please find page 72 of the 2008 US Airways annual report below. You can navigate through the pages in the report by either clicking on the pages listed below, or by using the keyword search tool below to find specific information within the annual report.-
 1
1 -
2
-
3
-
4
-
5
-
6
-
7
-
8
-
9
-
10
-
11
-
12
-
13
-
14
-
15
-
16
-
17
-
18
-
19
-
20
-
21
-
22
-
23
-
24
-
25
-
26
-
27
-
28
-
29
-
30
-
31
-
32
-
33
-
34
-
35
-
36
-
37
-
38
-
39
-
40
-
41
-
42
-
43
-
44
-
45
-
46
-
47
-
48
-
49
-
50
-
51
-
52
-
53
-
54
-
55
-
56
-
57
-
58
-
59
-
60
-
61
-
 62
62 -
 63
63 -
 64
64 -
 65
65 -
 66
66 -
 67
67 -
 68
68 -
 69
69 -
 70
70 -
 71
71 -
 72
72 -
 73
73 -
 74
74 -
 75
75 -
 76
76 -
 77
77 -
 78
78 -
 79
79 -
 80
80 -
 81
81 -
 82
82 -
83
-
84
-
85
-
86
-
87
-
88
-
89
-
90
-
91
-
92
-
93
-
94
-
95
-
96
-
97
-
98
-
99
-
100
-
101
-
102
-
103
-
104
-
105
-
106
-
107
-
108
-
109
-
110
-
111
-
112
-
113
-
114
-
115
-
116
-
117
-
118
-
119
-
120
-
121
-
122
-
123
-
124
-
125
-
126
-
127
-
128
-
129
-
130
-
131
-
132
-
133
-
134
-
135
-
136
-
137
-
138
-
139
-
140
-
141
-
142
-
143
-
144
-
145
-
146
-
147
-
148
-
149
-
150
-
151
-
152
-
153
-
154
-
155
-
156
-
157
-
158
-
159
-
160
-
161
-
162
-
163
-
164
-
165
-
166
-
167
-
168
-
169
-
170
-
171
-
172
-
173
-
174
-
175
-
176
-
177
-
178
-
179
-
180
-
181
-
182
-
183
-
184
-
185
-
186
-
187
-
188
-
189
-
190
-
191
-
192
-
193
-
194
-
195
-
196
-
197
-
198
-
199
-
200
-
201
-
202
-
203
-
204
-
205
-
206
-
207
-
208
-
209
-
210
-
211
-
212
-
213
-
214
-
215
-
216
-
217
-
218
-
219
-
220
-
221
-
222
-
223
-
224
-
225
-
226
-
227
-
228
-
229
-
230
-
231
-
232
-
233
-
234
-
235
-
236
-
237
-
238
-
239
-
240
-
241
-
242
-
243
-
244
-
245
-
246
-
247
-
248
-
249
-
250
-
251
-
252
-
253
-
254
-
255
-
256
-
257
-
258
-
259
-
260
-
261
-
262
-
263
-
264
-
265
-
266
-
267
-
268
-
269
-
270
-
271
-
272
-
273
-
274
-
275
-
276
-
277
-
278
-
279
-
280
-
281
-
282
-
283
-
284
-
285
-
286
-
287
-
288
-
289
-
290
-
291
-
292
-
293
-
294
-
295
-
296
-
297
-
298
-
299
-
300
-
301
-
302
-
303
-
304
-
305
-
306
-
307
-
308
-
309
-
310
-
311
-
312
-
313
-
314
-
315
-
316
-
317
-
318
-
319
-
320
-
321
-
322
-
323
-
324
-
325
-
326
-
327
-
328
-
329
-
330
-
331
-
332
-
333
-
334
-
335
-
336
-
337
-
338
-
339
-
340
-
341
-
342
-
343
-
344
-
345
-
346
-
347
-
348
-
349
-
350
-
351
-
352
-
353
-
354
-
355
-
356
-
357
-
358
-
359
-
360
-
361
-
362
-
363
-
364
-
365
-
366
-
367
-
368
-
369
-
370
-
371
-
372
-
373
-
374
-
375
-
376
-
377
-
378
-
379
-
380
-
381
-
382
-
383
-
384
-
385
-
386
-
387
-
388
-
389
-
390
-
391
-
392
-
393
-
394
-
395
-
396
-
397
-
398
-
399
-
400
-
401
 |
 |

Table of Contents
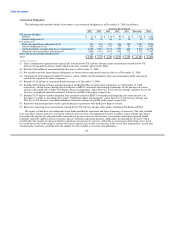
stock price in the second quarter of 2008 was $6.13 as compared to an average of $12.15 in the first quarter of 2008, a decline of 50%. In
addition, we announced in June 2008 that in response to the record high fuel prices, we planned to reduce fourth quarter 2008 and full
year 2009 domestic mainline capacity.
During the second quarter of 2008, we performed the first step of the two-step impairment test and compared the fair value of the
mainline reporting unit to its carrying value. Consistent with our approach in our annual impairment testing, in assessing the fair value of
the reporting unit, we considered both the market approach and income approach. Under the market approach, the fair value of the
reporting unit is based on quoted market prices and the number of shares outstanding for our common stock. Under the income approach,
the fair value of the reporting unit is based on the present value of estimated future cash flows. The income approach is dependent on a
number of significant management assumptions, including estimates of future capacity, passenger yield, traffic, fuel, other operating costs
and discount rates. Due to current market conditions, greater weighting was attributed to the market approach, which was weighted 67%
while the income approach was weighted 33% in arriving at the fair value of the reporting unit. We determined that the fair value of the
mainline reporting unit was less than the carrying value of the net assets of the reporting unit, and thus we performed step two of the
impairment test.
In step two of the impairment test, we determined the implied fair value of the goodwill and compared it to the carrying value of the
goodwill. We allocated the fair value of the reporting unit to all of our assets and liabilities as if the reporting unit had been acquired in a
business combination and the fair value of the mainline reporting unit was the price paid to acquire the reporting unit. The excess of the
fair value of the reporting unit over the amounts assigned to its assets and liabilities is the implied fair value of goodwill. Our step two
analysis resulted in no implied fair value of goodwill, and therefore, we recognized an impairment charge of $622 million in the second
quarter of 2008, representing a write off of the entire amount of our previously recorded goodwill.
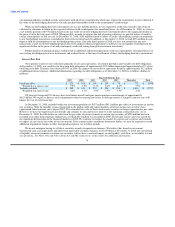
The following table reflects the change in the carrying amount of goodwill from December 31, 2007 (in millions):
Goodwill
Balance at December 31, 2007 $ 622
Impairment charge (622)
Balance at December 31, 2008 $ —
Impairment of Intangible and Other Assets
We assess the impairment of long-lived assets and intangible assets whenever events or changes in circumstances indicate that the
carrying value may not be recoverable. In addition, our international route authorities and trademark intangible assets are classified as
indefinite lived assets and are reviewed for impairment annually. Factors which could trigger an impairment review include the
following: significant changes in the manner of use of the assets; significant underperformance relative to historical or projected future
operating results; or significant negative industry or economic trends. An impairment has occurred when the future undiscounted cash
flows estimated to be generated by those assets are less than the carrying amount of those items. Cash flow estimates are based on
historical results adjusted to reflect management's best estimate of future market and operating conditions. The net carrying value of
assets not recoverable is reduced to fair value. Estimates of fair value represent management's best estimate based on appraisals, industry
trends and reference to market rates and transactions. Changes in industry capacity and demand for air transportation can significantly
impact the fair value of aircraft and related assets.
In connection with completing step two of our goodwill impairment analysis in the second quarter of 2008, we assessed the fair
values of our significant intangible assets. Our other intangible assets of $558 million as of June 30, 2008 consisted principally of airport
take-off and landing slots and airport gate leasehold rights of $473 million which are subject to amortization and $85 million of
international route authorities and trademarks which are classified as indefinite lived assets under SFAS No. 142. We considered the
potential impairment of these other intangible assets in accordance with SFAS No. 142 and SFAS No. 144, "Accounting for the
Impairment or Disposal of Long-Lived Assets," as applicable. The fair values of airport take-off and landing slots and international route
authorities were assessed using the market approach. The market approach took into consideration relevant supply
70