US Airways 2008 Annual Report Download - page 39
Download and view the complete annual report
Please find page 39 of the 2008 US Airways annual report below. You can navigate through the pages in the report by either clicking on the pages listed below, or by using the keyword search tool below to find specific information within the annual report.-
 1
1 -
2
-
3
-
4
-
5
-
6
-
7
-
8
-
9
-
10
-
11
-
12
-
13
-
14
-
15
-
16
-
17
-
18
-
19
-
20
-
21
-
22
-
23
-
24
-
25
-
26
-
27
-
28
-
 29
29 -
 30
30 -
 31
31 -
 32
32 -
 33
33 -
 34
34 -
 35
35 -
 36
36 -
 37
37 -
 38
38 -
 39
39 -
 40
40 -
 41
41 -
 42
42 -
 43
43 -
 44
44 -
 45
45 -
 46
46 -
 47
47 -
 48
48 -
 49
49 -
50
-
51
-
52
-
53
-
54
-
55
-
56
-
57
-
58
-
59
-
60
-
61
-
62
-
63
-
64
-
65
-
66
-
67
-
68
-
69
-
70
-
71
-
72
-
73
-
74
-
75
-
76
-
77
-
78
-
79
-
80
-
81
-
82
-
83
-
84
-
85
-
86
-
87
-
88
-
89
-
90
-
91
-
92
-
93
-
94
-
95
-
96
-
97
-
98
-
99
-
100
-
101
-
102
-
103
-
104
-
105
-
106
-
107
-
108
-
109
-
110
-
111
-
112
-
113
-
114
-
115
-
116
-
117
-
118
-
119
-
120
-
121
-
122
-
123
-
124
-
125
-
126
-
127
-
128
-
129
-
130
-
131
-
132
-
133
-
134
-
135
-
136
-
137
-
138
-
139
-
140
-
141
-
142
-
143
-
144
-
145
-
146
-
147
-
148
-
149
-
150
-
151
-
152
-
153
-
154
-
155
-
156
-
157
-
158
-
159
-
160
-
161
-
162
-
163
-
164
-
165
-
166
-
167
-
168
-
169
-
170
-
171
-
172
-
173
-
174
-
175
-
176
-
177
-
178
-
179
-
180
-
181
-
182
-
183
-
184
-
185
-
186
-
187
-
188
-
189
-
190
-
191
-
192
-
193
-
194
-
195
-
196
-
197
-
198
-
199
-
200
-
201
-
202
-
203
-
204
-
205
-
206
-
207
-
208
-
209
-
210
-
211
-
212
-
213
-
214
-
215
-
216
-
217
-
218
-
219
-
220
-
221
-
222
-
223
-
224
-
225
-
226
-
227
-
228
-
229
-
230
-
231
-
232
-
233
-
234
-
235
-
236
-
237
-
238
-
239
-
240
-
241
-
242
-
243
-
244
-
245
-
246
-
247
-
248
-
249
-
250
-
251
-
252
-
253
-
254
-
255
-
256
-
257
-
258
-
259
-
260
-
261
-
262
-
263
-
264
-
265
-
266
-
267
-
268
-
269
-
270
-
271
-
272
-
273
-
274
-
275
-
276
-
277
-
278
-
279
-
280
-
281
-
282
-
283
-
284
-
285
-
286
-
287
-
288
-
289
-
290
-
291
-
292
-
293
-
294
-
295
-
296
-
297
-
298
-
299
-
300
-
301
-
302
-
303
-
304
-
305
-
306
-
307
-
308
-
309
-
310
-
311
-
312
-
313
-
314
-
315
-
316
-
317
-
318
-
319
-
320
-
321
-
322
-
323
-
324
-
325
-
326
-
327
-
328
-
329
-
330
-
331
-
332
-
333
-
334
-
335
-
336
-
337
-
338
-
339
-
340
-
341
-
342
-
343
-
344
-
345
-
346
-
347
-
348
-
349
-
350
-
351
-
352
-
353
-
354
-
355
-
356
-
357
-
358
-
359
-
360
-
361
-
362
-
363
-
364
-
365
-
366
-
367
-
368
-
369
-
370
-
371
-
372
-
373
-
374
-
375
-
376
-
377
-
378
-
379
-
380
-
381
-
382
-
383
-
384
-
385
-
386
-
387
-
388
-
389
-
390
-
391
-
392
-
393
-
394
-
395
-
396
-
397
-
398
-
399
-
400
-
401
 |
 |

Table of Contents
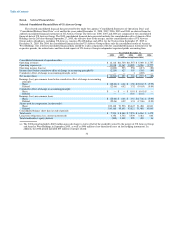
losses. These factors served as a catalyst for some airlines to take the following unprecedented measures to support growth in ticket prices
and preserve liquidity:
• Substantial capacity reductions. Domestic ASMs are expected to be down approximately 10% in 2009 as compared to 2008 for
the U.S. airline industry. These capacity cuts are expected to minimize the impact of reduced passenger demand on revenue,
reduce costs and minimize cash burn.
• Development and implementation of new revenue initiatives to supplement existing sources of revenue.
• Implementation of cost containment strategies to minimize non-essential expenditures and conserve cash.
• Enhancement of near-term liquidity through a number of cash-raising initiatives such as traditional capital market issuances,
asset sales, sale and leaseback transactions and prepaid sales of miles to affinity card issuers.
The then rapid and severe increases in fuel prices, which appeared to have no end as oil hit an all time high of $147 per barrel in
July 2008, prompted some airlines to contain costs by increasing their fuel hedge positions. With the industry facing a liquidity crisis,
many airlines' hedge positions took the form of no premium collars and swaps, as the cost of traditional call options to lock in fuel cost
became too expensive due to the volatility in oil prices. By the end of the third quarter, the rapid climb in oil prices was quickly replaced
by an equally rapid decline in oil prices, driven by a global economic downturn. While the industry welcomed relief in the price of fuel,
hedges entered into earlier in the year, ahead of fuel's rapid decline, generated losses and a near term drain on liquidity as airlines were
forced to post significant amounts of collateral with their fuel hedging counterparties.
As the industry enters 2009, moderating oil prices are expected to offset at least some of the effects on passenger demand of the
corresponding weakening economy. Additionally, we believe the unprecedented industry actions described above to reduce capacity,
support ticket prices and implement new sources of revenue will further mitigate the impacts of the economic downturn.
US Airways' Response
As described above, the industry was profoundly challenged by the economic environment in 2008. We participated in the
industry's response to the then record high fuel prices and took action to operate a strong and competitive airline by implementing
initiatives as discussed below.
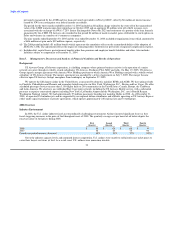
Capacity and Fleet Reductions
We reduced our fourth quarter 2008 total mainline capacity by 5.9% and our Express capacity by 1.3% on a year-over-year basis. In
addition, we plan to reduce our total mainline 2009 capacity by four to six percent and our Express capacity by five to seven percent from
2008 levels. We anticipate that these capacity reductions will enable us to minimize the impact of reduced passenger demand on revenue
and reduce costs.
We have taken the following steps to achieve our capacity reduction goals:
• Fleet Reduction: We announced the return of ten aircraft to lessors, which included six Boeing 737-300 aircraft returned in 2008
and early 2009 as well as four Airbus A320 aircraft to be returned in the first half of 2009. We have also cancelled the leases of
two A330-200 wide-body aircraft that had been scheduled for delivery in the second half of 2009. Further, we plan to reduce
additional aircraft in 2009 and 2010.
• Las Vegas Flight Reduction: We closed our Las Vegas night operation, except for limited night service to the East Coast, in
early September 2008. In the current environment, the revenue generated from the Las Vegas night operation no longer exceeded
the incremental cost of that flying. Overall, daily departures from Las Vegas, which were as high as 141 during September 2007,
have been reduced to 77 as of the end of 2008.
New Revenue Initiatives
We implemented several new revenue initiatives in 2008 in order to generate additional revenue. These include a first and second
checked bag service fee, a new beverage purchase program, processing fees for travel awards issued through our Dividend Miles frequent
traveler program, our new Choice Seats program, increases to the cost
37