US Airways 2008 Annual Report Download - page 165
Download and view the complete annual report
Please find page 165 of the 2008 US Airways annual report below. You can navigate through the pages in the report by either clicking on the pages listed below, or by using the keyword search tool below to find specific information within the annual report.-
 1
1 -
2
-
3
-
4
-
5
-
6
-
7
-
8
-
9
-
10
-
11
-
12
-
13
-
14
-
15
-
16
-
17
-
18
-
19
-
20
-
21
-
22
-
23
-
24
-
25
-
26
-
27
-
28
-
29
-
30
-
31
-
32
-
33
-
34
-
35
-
36
-
37
-
38
-
39
-
40
-
41
-
42
-
43
-
44
-
45
-
46
-
47
-
48
-
49
-
50
-
51
-
52
-
53
-
54
-
55
-
56
-
57
-
58
-
59
-
60
-
61
-
62
-
63
-
64
-
65
-
66
-
67
-
68
-
69
-
70
-
71
-
72
-
73
-
74
-
75
-
76
-
77
-
78
-
79
-
80
-
81
-
82
-
83
-
84
-
85
-
86
-
87
-
88
-
89
-
90
-
91
-
92
-
93
-
94
-
95
-
96
-
97
-
98
-
99
-
100
-
101
-
102
-
103
-
104
-
105
-
106
-
107
-
108
-
109
-
110
-
111
-
112
-
113
-
114
-
115
-
116
-
117
-
118
-
119
-
120
-
121
-
122
-
123
-
124
-
125
-
126
-
127
-
128
-
129
-
130
-
131
-
132
-
133
-
134
-
135
-
136
-
137
-
138
-
139
-
140
-
141
-
142
-
143
-
144
-
145
-
146
-
147
-
148
-
149
-
150
-
151
-
152
-
153
-
154
-
 155
155 -
 156
156 -
 157
157 -
 158
158 -
 159
159 -
 160
160 -
 161
161 -
 162
162 -
 163
163 -
 164
164 -
 165
165 -
 166
166 -
 167
167 -
 168
168 -
 169
169 -
 170
170 -
 171
171 -
 172
172 -
 173
173 -
 174
174 -
 175
175 -
176
-
177
-
178
-
179
-
180
-
181
-
182
-
183
-
184
-
185
-
186
-
187
-
188
-
189
-
190
-
191
-
192
-
193
-
194
-
195
-
196
-
197
-
198
-
199
-
200
-
201
-
202
-
203
-
204
-
205
-
206
-
207
-
208
-
209
-
210
-
211
-
212
-
213
-
214
-
215
-
216
-
217
-
218
-
219
-
220
-
221
-
222
-
223
-
224
-
225
-
226
-
227
-
228
-
229
-
230
-
231
-
232
-
233
-
234
-
235
-
236
-
237
-
238
-
239
-
240
-
241
-
242
-
243
-
244
-
245
-
246
-
247
-
248
-
249
-
250
-
251
-
252
-
253
-
254
-
255
-
256
-
257
-
258
-
259
-
260
-
261
-
262
-
263
-
264
-
265
-
266
-
267
-
268
-
269
-
270
-
271
-
272
-
273
-
274
-
275
-
276
-
277
-
278
-
279
-
280
-
281
-
282
-
283
-
284
-
285
-
286
-
287
-
288
-
289
-
290
-
291
-
292
-
293
-
294
-
295
-
296
-
297
-
298
-
299
-
300
-
301
-
302
-
303
-
304
-
305
-
306
-
307
-
308
-
309
-
310
-
311
-
312
-
313
-
314
-
315
-
316
-
317
-
318
-
319
-
320
-
321
-
322
-
323
-
324
-
325
-
326
-
327
-
328
-
329
-
330
-
331
-
332
-
333
-
334
-
335
-
336
-
337
-
338
-
339
-
340
-
341
-
342
-
343
-
344
-
345
-
346
-
347
-
348
-
349
-
350
-
351
-
352
-
353
-
354
-
355
-
356
-
357
-
358
-
359
-
360
-
361
-
362
-
363
-
364
-
365
-
366
-
367
-
368
-
369
-
370
-
371
-
372
-
373
-
374
-
375
-
376
-
377
-
378
-
379
-
380
-
381
-
382
-
383
-
384
-
385
-
386
-
387
-
388
-
389
-
390
-
391
-
392
-
393
-
394
-
395
-
396
-
397
-
398
-
399
-
400
-
401
 |
 |
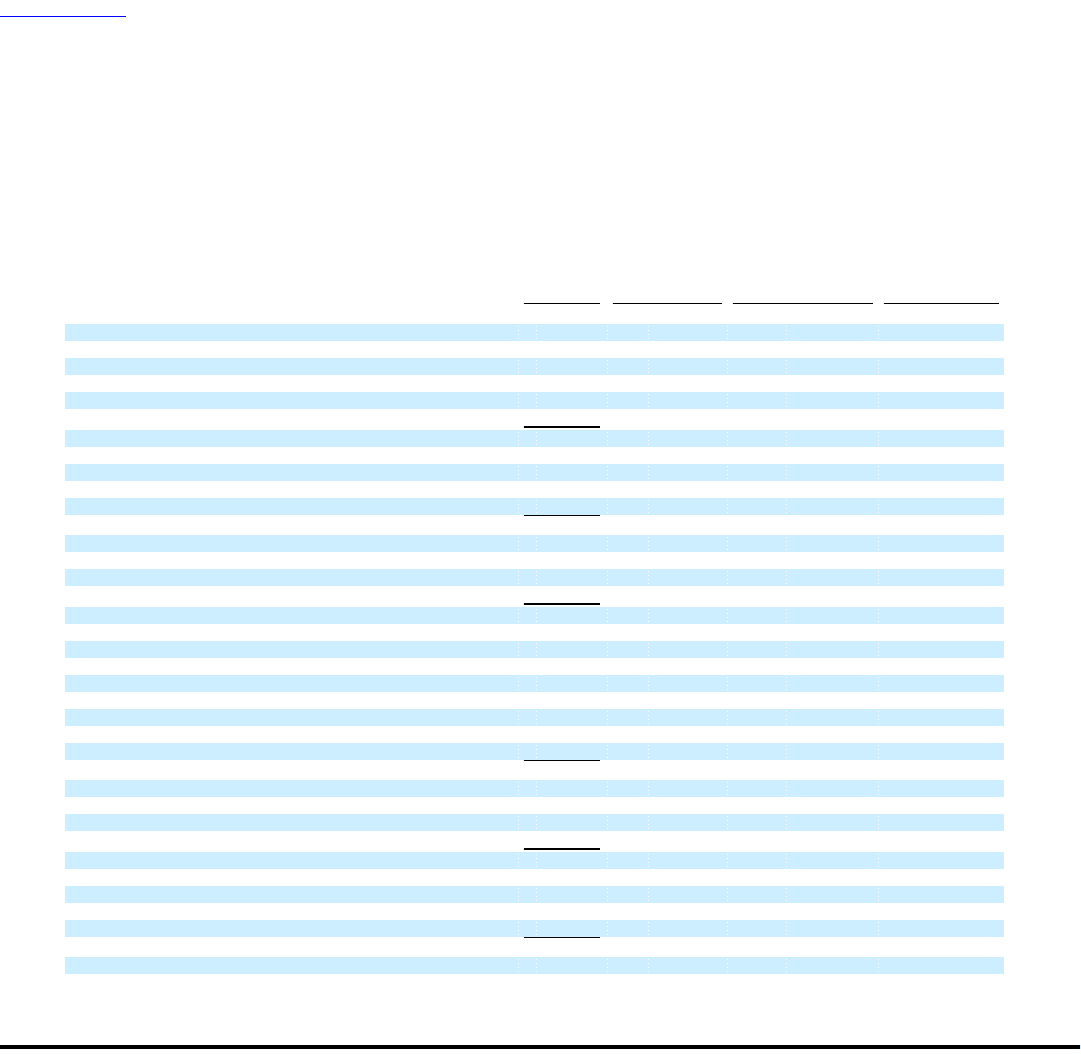
Table of Contents
US Airways, Inc.
Notes to Consolidated Financial Statements — (Continued)
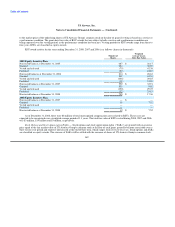
Stock option and SARs activity for the years ending December 31, 2008, 2007 and 2006 is as follows (stock options and SARs in
thousands):
Weighted
Average
Stock Weighted Remaining
Options Average Contractual Term Aggregate
and SARs Exercise Price (Years) Intrinsic Value
(In millions)
1994 Incentive Equity Plan
Balance at December 31, 2005 1,267 $ 38.28
Granted — —
Exercised (455) 23.64
Forfeited — —
Expired (62) 50.93
Balance at December 31, 2006 750 $ 46.10
Granted — —
Exercised (30) 40.93
Forfeited — —
Expired (75) 46.38
Balance at December 31, 2007 645 $ 46.30
Granted — —
Exercised (2) 9.21
Forfeited — —
Expired (244) 55.35
Balance at December 31, 2008 399 $ 40.96 1.04 $ —
Vested or expected to vest at December 31, 2008 399 $ 40.96 1.04 $ —
Exercisable at December 31, 2008 399 $ 40.96 1.04 $ —
2002 Incentive Equity Plan
Balance at December 31, 2005 2,048 $ 16.98
Granted — —
Exercised (1,250) 16.12
Forfeited — —
Expired — —
Balance at December 31, 2006 798 $ 18.33
Granted — —
Exercised (36) 14.36
Forfeited — —
Expired — —
Balance at December 31, 2007 762 $ 18.52
Granted — —
Exercised (2) 6.42
Forfeited — —
Expired (23) 25.08
Balance at December 31, 2008 737 $ 18.34 4.95 $ —
Vested or expected to vest at December 31, 2008 735 $ 18.33 4.95 $ —
Exercisable at December 31, 2008 686 $ 18.15 4.83 $ —
163