US Airways 2008 Annual Report Download - page 42
Download and view the complete annual report
Please find page 42 of the 2008 US Airways annual report below. You can navigate through the pages in the report by either clicking on the pages listed below, or by using the keyword search tool below to find specific information within the annual report.-
 1
1 -
2
-
3
-
4
-
5
-
6
-
7
-
8
-
9
-
10
-
11
-
12
-
13
-
14
-
15
-
16
-
17
-
18
-
19
-
20
-
21
-
22
-
23
-
24
-
25
-
26
-
27
-
28
-
29
-
30
-
31
-
 32
32 -
 33
33 -
 34
34 -
 35
35 -
 36
36 -
 37
37 -
 38
38 -
 39
39 -
 40
40 -
 41
41 -
 42
42 -
 43
43 -
 44
44 -
 45
45 -
 46
46 -
 47
47 -
 48
48 -
 49
49 -
 50
50 -
 51
51 -
 52
52 -
53
-
54
-
55
-
56
-
57
-
58
-
59
-
60
-
61
-
62
-
63
-
64
-
65
-
66
-
67
-
68
-
69
-
70
-
71
-
72
-
73
-
74
-
75
-
76
-
77
-
78
-
79
-
80
-
81
-
82
-
83
-
84
-
85
-
86
-
87
-
88
-
89
-
90
-
91
-
92
-
93
-
94
-
95
-
96
-
97
-
98
-
99
-
100
-
101
-
102
-
103
-
104
-
105
-
106
-
107
-
108
-
109
-
110
-
111
-
112
-
113
-
114
-
115
-
116
-
117
-
118
-
119
-
120
-
121
-
122
-
123
-
124
-
125
-
126
-
127
-
128
-
129
-
130
-
131
-
132
-
133
-
134
-
135
-
136
-
137
-
138
-
139
-
140
-
141
-
142
-
143
-
144
-
145
-
146
-
147
-
148
-
149
-
150
-
151
-
152
-
153
-
154
-
155
-
156
-
157
-
158
-
159
-
160
-
161
-
162
-
163
-
164
-
165
-
166
-
167
-
168
-
169
-
170
-
171
-
172
-
173
-
174
-
175
-
176
-
177
-
178
-
179
-
180
-
181
-
182
-
183
-
184
-
185
-
186
-
187
-
188
-
189
-
190
-
191
-
192
-
193
-
194
-
195
-
196
-
197
-
198
-
199
-
200
-
201
-
202
-
203
-
204
-
205
-
206
-
207
-
208
-
209
-
210
-
211
-
212
-
213
-
214
-
215
-
216
-
217
-
218
-
219
-
220
-
221
-
222
-
223
-
224
-
225
-
226
-
227
-
228
-
229
-
230
-
231
-
232
-
233
-
234
-
235
-
236
-
237
-
238
-
239
-
240
-
241
-
242
-
243
-
244
-
245
-
246
-
247
-
248
-
249
-
250
-
251
-
252
-
253
-
254
-
255
-
256
-
257
-
258
-
259
-
260
-
261
-
262
-
263
-
264
-
265
-
266
-
267
-
268
-
269
-
270
-
271
-
272
-
273
-
274
-
275
-
276
-
277
-
278
-
279
-
280
-
281
-
282
-
283
-
284
-
285
-
286
-
287
-
288
-
289
-
290
-
291
-
292
-
293
-
294
-
295
-
296
-
297
-
298
-
299
-
300
-
301
-
302
-
303
-
304
-
305
-
306
-
307
-
308
-
309
-
310
-
311
-
312
-
313
-
314
-
315
-
316
-
317
-
318
-
319
-
320
-
321
-
322
-
323
-
324
-
325
-
326
-
327
-
328
-
329
-
330
-
331
-
332
-
333
-
334
-
335
-
336
-
337
-
338
-
339
-
340
-
341
-
342
-
343
-
344
-
345
-
346
-
347
-
348
-
349
-
350
-
351
-
352
-
353
-
354
-
355
-
356
-
357
-
358
-
359
-
360
-
361
-
362
-
363
-
364
-
365
-
366
-
367
-
368
-
369
-
370
-
371
-
372
-
373
-
374
-
375
-
376
-
377
-
378
-
379
-
380
-
381
-
382
-
383
-
384
-
385
-
386
-
387
-
388
-
389
-
390
-
391
-
392
-
393
-
394
-
395
-
396
-
397
-
398
-
399
-
400
-
401
 |
 |

Table of Contents
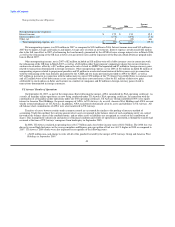
While the impact of the weakening economic environment on future passenger demand remains uncertain, we believe that the
current decline in aviation fuel prices will offset at least some of the potential impacts. We estimate that a one cent per gallon decrease in
fuel prices results in a $14 million decrease in our annual fuel expense. As discussed above, we have taken numerous actions to increase
revenue, reduce costs and preserve liquidity. We believe these actions have positioned us well for a difficult global economy in 2009.
Customer Service
We are committed to running a successful airline. One of the important ways we do this is by taking care of our customers. We
believe that our focus on excellent customer service in every aspect of our operations, including personnel, flight equipment, inflight and
ancillary amenities, on-time performance, flight completion ratios and baggage handling, will strengthen customer loyalty and attract new
customers.
Throughout 2007 and 2008, we implemented several ongoing initiatives to improve operational performance, including lengthening
the operating day at our hubs, lowering utilization, increasing the number of designated spare aircraft in order to ensure operational
reliability and implementing new baggage handling software and handheld baggage scanners. The implementation of these initiatives
along with other performance improvement initiatives resulted in an improved trend in operational performance.
For the year 2008, our 80.1% on-time performance ranked first among the big six hub and spoke carriers and second among the ten
largest U.S. airlines as measured by the DOT's Consumer Air Travel Report. In addition, our mishandled baggage ratio per 1,000
passengers improved dramatically to 4.77, representing more than a 40% improvement from our 2007 rate of 8.47. Our rate of customer
complaints filed with the DOT per 100,000 passengers also improved, decreasing to 2.01 in 2008 from 3.16 in 2007.
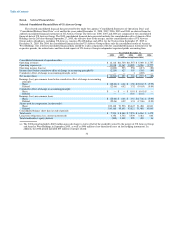
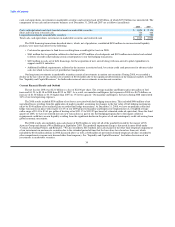
We reported the following combined operating statistics to the DOT for mainline operations for the years ended December 31,
2008, 2007 and 2006:
Full Year
2008 2007 2006
On-time performance(a) 80.1 68.7 76.9
Completion factor(b) 98.5 98.2 98.9
Mishandled baggage(c) 4.77 8.47 7.88
Customer complaints(d) 2.01 3.16 1.36
(a) Percentage of reported flight operations arriving on time as defined by the DOT.
(b) Percentage of scheduled flight operations completed.
(c) Rate of mishandled baggage reports per 1,000 passengers.
(d) Rate of customer complaints filed with the DOT per 100,000 passengers.
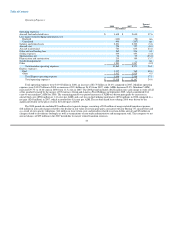
US Airways Group's Results of Operations
In 2008, we realized an operating loss of $1.8 billion and a loss before income taxes of $2.21 billion. The 2008 loss was driven by
record high fuel prices as the average mainline and Express price per gallon of fuel was 44.1% higher in 2008 as compared to 2007. Our
2008 results were also impacted by recognition of the following items:
• a $622 million non-cash charge to write off all of the goodwill created by the merger of US Airways Group and America West
Holdings in September 2005.
• $214 million in other than temporary non-cash impairment charges included in nonoperating expense for our investments in
auction rate securities primarily driven by the length of time and extent to which the fair value has been less than cost for these
securities.
• $496 million of net unrealized losses resulting from the application of mark-to-market accounting for changes in the fair value of
fuel hedging instruments, offset by $140 million of net realized gains on settled fuel hedge transactions. The net unrealized losses
were primarily driven by the significant decrease in the
40