US Airways 2008 Annual Report Download - page 125
Download and view the complete annual report
Please find page 125 of the 2008 US Airways annual report below. You can navigate through the pages in the report by either clicking on the pages listed below, or by using the keyword search tool below to find specific information within the annual report.-
 1
1 -
2
-
3
-
4
-
5
-
6
-
7
-
8
-
9
-
10
-
11
-
12
-
13
-
14
-
15
-
16
-
17
-
18
-
19
-
20
-
21
-
22
-
23
-
24
-
25
-
26
-
27
-
28
-
29
-
30
-
31
-
32
-
33
-
34
-
35
-
36
-
37
-
38
-
39
-
40
-
41
-
42
-
43
-
44
-
45
-
46
-
47
-
48
-
49
-
50
-
51
-
52
-
53
-
54
-
55
-
56
-
57
-
58
-
59
-
60
-
61
-
62
-
63
-
64
-
65
-
66
-
67
-
68
-
69
-
70
-
71
-
72
-
73
-
74
-
75
-
76
-
77
-
78
-
79
-
80
-
81
-
82
-
83
-
84
-
85
-
86
-
87
-
88
-
89
-
90
-
91
-
92
-
93
-
94
-
95
-
96
-
97
-
98
-
99
-
100
-
101
-
102
-
103
-
104
-
105
-
106
-
107
-
108
-
109
-
110
-
111
-
112
-
113
-
114
-
 115
115 -
 116
116 -
 117
117 -
 118
118 -
 119
119 -
 120
120 -
 121
121 -
 122
122 -
 123
123 -
 124
124 -
 125
125 -
 126
126 -
 127
127 -
 128
128 -
 129
129 -
 130
130 -
 131
131 -
 132
132 -
 133
133 -
 134
134 -
 135
135 -
136
-
137
-
138
-
139
-
140
-
141
-
142
-
143
-
144
-
145
-
146
-
147
-
148
-
149
-
150
-
151
-
152
-
153
-
154
-
155
-
156
-
157
-
158
-
159
-
160
-
161
-
162
-
163
-
164
-
165
-
166
-
167
-
168
-
169
-
170
-
171
-
172
-
173
-
174
-
175
-
176
-
177
-
178
-
179
-
180
-
181
-
182
-
183
-
184
-
185
-
186
-
187
-
188
-
189
-
190
-
191
-
192
-
193
-
194
-
195
-
196
-
197
-
198
-
199
-
200
-
201
-
202
-
203
-
204
-
205
-
206
-
207
-
208
-
209
-
210
-
211
-
212
-
213
-
214
-
215
-
216
-
217
-
218
-
219
-
220
-
221
-
222
-
223
-
224
-
225
-
226
-
227
-
228
-
229
-
230
-
231
-
232
-
233
-
234
-
235
-
236
-
237
-
238
-
239
-
240
-
241
-
242
-
243
-
244
-
245
-
246
-
247
-
248
-
249
-
250
-
251
-
252
-
253
-
254
-
255
-
256
-
257
-
258
-
259
-
260
-
261
-
262
-
263
-
264
-
265
-
266
-
267
-
268
-
269
-
270
-
271
-
272
-
273
-
274
-
275
-
276
-
277
-
278
-
279
-
280
-
281
-
282
-
283
-
284
-
285
-
286
-
287
-
288
-
289
-
290
-
291
-
292
-
293
-
294
-
295
-
296
-
297
-
298
-
299
-
300
-
301
-
302
-
303
-
304
-
305
-
306
-
307
-
308
-
309
-
310
-
311
-
312
-
313
-
314
-
315
-
316
-
317
-
318
-
319
-
320
-
321
-
322
-
323
-
324
-
325
-
326
-
327
-
328
-
329
-
330
-
331
-
332
-
333
-
334
-
335
-
336
-
337
-
338
-
339
-
340
-
341
-
342
-
343
-
344
-
345
-
346
-
347
-
348
-
349
-
350
-
351
-
352
-
353
-
354
-
355
-
356
-
357
-
358
-
359
-
360
-
361
-
362
-
363
-
364
-
365
-
366
-
367
-
368
-
369
-
370
-
371
-
372
-
373
-
374
-
375
-
376
-
377
-
378
-
379
-
380
-
381
-
382
-
383
-
384
-
385
-
386
-
387
-
388
-
389
-
390
-
391
-
392
-
393
-
394
-
395
-
396
-
397
-
398
-
399
-
400
-
401
 |
 |

Table of Contents
US Airways Group, Inc.
Notes to Consolidated Financial Statements — (Continued)
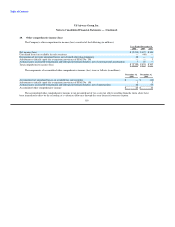
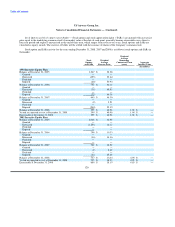
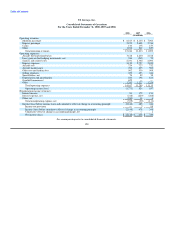
16. Valuation and qualifying accounts (in millions)
Balance at Balance at
Beginning End
Description of Period Additions Deductions of Period
Allowance for doubtful receivables:
Year ended December 31, 2008 $ 4 $ 10 $ 8 $ 6
Year ended December 31, 2007 $ 8 $ 9 $ 13 $ 4
Year ended December 31, 2006 $ 10 $ 7 $ 9 $ 8
Allowance for inventory obsolescence:
Year ended December 31, 2008 $ 40 $ 21 $ 10 $ 51
Year ended December 31, 2007 $ 30 $ 12 $ 2 $ 40
Year ended December 31, 2006 $ 24 $ 10 $ 4 $ 30
Valuation allowance on deferred tax asset, net:
Year ended December 31, 2008 $ 77 $ 573 $ — $ 650
Year ended December 31, 2007 $ 263 $ — $ 186 $ 77
Year ended December 31, 2006 $ 446 $ — $ 183 $ 263
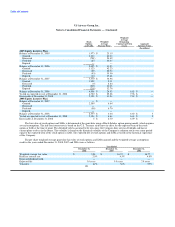
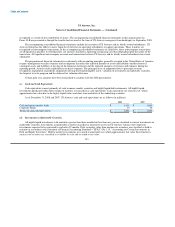
17. Selected quarterly financial information (unaudited)
Summarized quarterly financial information for 2008 and 2007 is as follows (in millions):
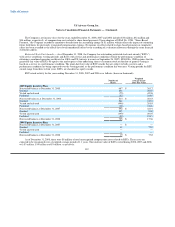
1st Quarter 2nd Quarter 3rd Quarter 4th Quarter
2008
Operating revenues $ 2,840 $ 3,257 $ 3,261 $ 2,761
Operating expenses 3,036 3,793 3,950 3,139
Operating loss (196) (536) (689) (378)
Nonoperating expenses, net (40) (31) (173) (166)
Income tax provision (benefit) — — 3 (3)
Net loss (236) (567) (865) (541)
Loss per common share:
Basic: $ (2.56) $ (6.16) $ (8.45) $ (4.74)
Diluted: $ (2.56) $ (6.16) $ (8.45) $ (4.74)
Shares used for computation (in thousands):
Basic 92,023 92,137 102,406 114,106
Diluted 92,023 92,137 102,406 114,106
2007
Operating revenues $ 2,732 $ 3,155 $ 3,036 $ 2,776
Operating expenses 2,616 2,866 2,834 2,850
Operating income (loss) 116 289 202 (74)
Nonoperating expenses, net (47) (18) (21) (13)
Income tax provision (benefit) 3 8 4 (8)
Net income (loss) 66 263 177 (79)
Earnings (loss) per common share:
Basic: $ 0.73 $ 2.88 $ 1.93 $ (0.87)
Diluted: $ 0.70 $ 2.77 $ 1.87 $ (0.87)
Shares used for computation (in thousands):
Basic 91,363 91,477 91,542 91,761
Diluted 96,223 95,613 95,492 91,761
123