US Airways 2008 Annual Report Download - page 119
Download and view the complete annual report
Please find page 119 of the 2008 US Airways annual report below. You can navigate through the pages in the report by either clicking on the pages listed below, or by using the keyword search tool below to find specific information within the annual report.-
 1
1 -
2
-
3
-
4
-
5
-
6
-
7
-
8
-
9
-
10
-
11
-
12
-
13
-
14
-
15
-
16
-
17
-
18
-
19
-
20
-
21
-
22
-
23
-
24
-
25
-
26
-
27
-
28
-
29
-
30
-
31
-
32
-
33
-
34
-
35
-
36
-
37
-
38
-
39
-
40
-
41
-
42
-
43
-
44
-
45
-
46
-
47
-
48
-
49
-
50
-
51
-
52
-
53
-
54
-
55
-
56
-
57
-
58
-
59
-
60
-
61
-
62
-
63
-
64
-
65
-
66
-
67
-
68
-
69
-
70
-
71
-
72
-
73
-
74
-
75
-
76
-
77
-
78
-
79
-
80
-
81
-
82
-
83
-
84
-
85
-
86
-
87
-
88
-
89
-
90
-
91
-
92
-
93
-
94
-
95
-
96
-
97
-
98
-
99
-
100
-
101
-
102
-
103
-
104
-
105
-
106
-
107
-
108
-
 109
109 -
 110
110 -
 111
111 -
 112
112 -
 113
113 -
 114
114 -
 115
115 -
 116
116 -
 117
117 -
 118
118 -
 119
119 -
 120
120 -
 121
121 -
 122
122 -
 123
123 -
 124
124 -
 125
125 -
 126
126 -
 127
127 -
 128
128 -
 129
129 -
130
-
131
-
132
-
133
-
134
-
135
-
136
-
137
-
138
-
139
-
140
-
141
-
142
-
143
-
144
-
145
-
146
-
147
-
148
-
149
-
150
-
151
-
152
-
153
-
154
-
155
-
156
-
157
-
158
-
159
-
160
-
161
-
162
-
163
-
164
-
165
-
166
-
167
-
168
-
169
-
170
-
171
-
172
-
173
-
174
-
175
-
176
-
177
-
178
-
179
-
180
-
181
-
182
-
183
-
184
-
185
-
186
-
187
-
188
-
189
-
190
-
191
-
192
-
193
-
194
-
195
-
196
-
197
-
198
-
199
-
200
-
201
-
202
-
203
-
204
-
205
-
206
-
207
-
208
-
209
-
210
-
211
-
212
-
213
-
214
-
215
-
216
-
217
-
218
-
219
-
220
-
221
-
222
-
223
-
224
-
225
-
226
-
227
-
228
-
229
-
230
-
231
-
232
-
233
-
234
-
235
-
236
-
237
-
238
-
239
-
240
-
241
-
242
-
243
-
244
-
245
-
246
-
247
-
248
-
249
-
250
-
251
-
252
-
253
-
254
-
255
-
256
-
257
-
258
-
259
-
260
-
261
-
262
-
263
-
264
-
265
-
266
-
267
-
268
-
269
-
270
-
271
-
272
-
273
-
274
-
275
-
276
-
277
-
278
-
279
-
280
-
281
-
282
-
283
-
284
-
285
-
286
-
287
-
288
-
289
-
290
-
291
-
292
-
293
-
294
-
295
-
296
-
297
-
298
-
299
-
300
-
301
-
302
-
303
-
304
-
305
-
306
-
307
-
308
-
309
-
310
-
311
-
312
-
313
-
314
-
315
-
316
-
317
-
318
-
319
-
320
-
321
-
322
-
323
-
324
-
325
-
326
-
327
-
328
-
329
-
330
-
331
-
332
-
333
-
334
-
335
-
336
-
337
-
338
-
339
-
340
-
341
-
342
-
343
-
344
-
345
-
346
-
347
-
348
-
349
-
350
-
351
-
352
-
353
-
354
-
355
-
356
-
357
-
358
-
359
-
360
-
361
-
362
-
363
-
364
-
365
-
366
-
367
-
368
-
369
-
370
-
371
-
372
-
373
-
374
-
375
-
376
-
377
-
378
-
379
-
380
-
381
-
382
-
383
-
384
-
385
-
386
-
387
-
388
-
389
-
390
-
391
-
392
-
393
-
394
-
395
-
396
-
397
-
398
-
399
-
400
-
401
 |
 |

Table of Contents
US Airways Group, Inc.
Notes to Consolidated Financial Statements — (Continued)
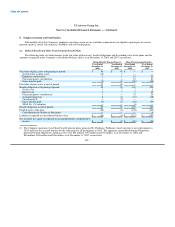
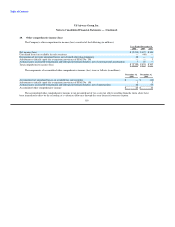
11. Supplemental cash flow information
Supplemental disclosure of cash flow information and non-cash investing and financing activities were as follows (in millions):
Year Ended December 31,
2008 2007 2006
Non-cash transactions:
Interest payable converted to debt $ 7 $ — $ —
Maintenance payable converted to debt 33 — —
Unrealized loss on available for sale securities — 48 —
Conversion of 7% convertible notes into common stock — — 70
Conversion of 7.5% convertible senior notes, net of discount of $17 million to common stock — — 95
Notes payable canceled under the aircraft purchase agreement — — 4
Equipment purchases financed by capital lease — — 3
Cash transactions:
Interest paid, net of amounts capitalized 216 248 264
Income taxes paid 1 4 12
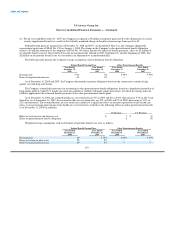
12. Related party transactions
Richard A. Bartlett, a member of the Company's board of directors until June 2008, is a greater than 10% owner of Air Wisconsin.
US Airways and Air Wisconsin also entered into a regional jet services agreement under which Air Wisconsin may, but is not required to,
provide regional jet service under a US Airways Express code share arrangement. On April 8, 2005, Air Wisconsin notified the Company
of its intention to deploy 70 regional jets, the maximum number provided for in the agreement, into the US Airways Express network.
The amount paid to Air Wisconsin in 2008 was approximately $344 million. Mr. Bartlett became a member of the board of directors
pursuant to certain stockholder agreements, which by their terms expired in June 2008.
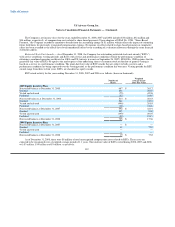
Edward L. Shapiro, a member of the Company's board of directors until June 2008, is a Vice President and partner of PAR Capital
Management, the general partner of PAR. PAR received 10,768,485 shares of US Airways Group common stock, including shares
received pursuant to Participation Agreements with America West Holdings, for a total investment of $160 million at the time of the
merger. As of December 31, 2007, PAR has sold substantially all of its investment in the Company. Mr. Shapiro became a member of the
board of directors pursuant to certain stockholder agreements, which by their terms expired in June 2008.
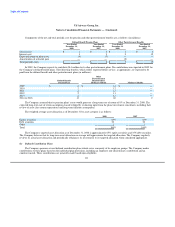
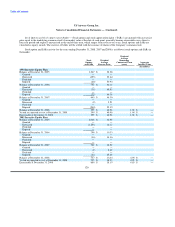
13. Operating segments and related disclosures
The Company is managed as a single business unit that provides air transportation for passengers and cargo. This allows it to benefit
from an integrated revenue pricing and route network that includes US Airways, Piedmont, PSA and third-party carriers that fly under
capacity purchase or prorate agreements as part of the Company's Express operations. The flight equipment of all these carriers is
combined to form one fleet that is deployed through a single route scheduling system. When making resource allocation decisions, the
chief operating decision maker evaluates flight profitability data, which considers aircraft type and route economics, but gives no weight
to the financial impact of the resource allocation decision on an individual carrier basis. The objective in making resource allocation
decisions is to maximize consolidated financial results, not the individual results of US Airways, Piedmont and PSA.
117