US Airways 2008 Annual Report Download - page 138
Download and view the complete annual report
Please find page 138 of the 2008 US Airways annual report below. You can navigate through the pages in the report by either clicking on the pages listed below, or by using the keyword search tool below to find specific information within the annual report.-
 1
1 -
2
-
3
-
4
-
5
-
6
-
7
-
8
-
9
-
10
-
11
-
12
-
13
-
14
-
15
-
16
-
17
-
18
-
19
-
20
-
21
-
22
-
23
-
24
-
25
-
26
-
27
-
28
-
29
-
30
-
31
-
32
-
33
-
34
-
35
-
36
-
37
-
38
-
39
-
40
-
41
-
42
-
43
-
44
-
45
-
46
-
47
-
48
-
49
-
50
-
51
-
52
-
53
-
54
-
55
-
56
-
57
-
58
-
59
-
60
-
61
-
62
-
63
-
64
-
65
-
66
-
67
-
68
-
69
-
70
-
71
-
72
-
73
-
74
-
75
-
76
-
77
-
78
-
79
-
80
-
81
-
82
-
83
-
84
-
85
-
86
-
87
-
88
-
89
-
90
-
91
-
92
-
93
-
94
-
95
-
96
-
97
-
98
-
99
-
100
-
101
-
102
-
103
-
104
-
105
-
106
-
107
-
108
-
109
-
110
-
111
-
112
-
113
-
114
-
115
-
116
-
117
-
118
-
119
-
120
-
121
-
122
-
123
-
124
-
125
-
126
-
127
-
 128
128 -
 129
129 -
 130
130 -
 131
131 -
 132
132 -
 133
133 -
 134
134 -
 135
135 -
 136
136 -
 137
137 -
 138
138 -
 139
139 -
 140
140 -
 141
141 -
 142
142 -
 143
143 -
 144
144 -
 145
145 -
 146
146 -
 147
147 -
 148
148 -
149
-
150
-
151
-
152
-
153
-
154
-
155
-
156
-
157
-
158
-
159
-
160
-
161
-
162
-
163
-
164
-
165
-
166
-
167
-
168
-
169
-
170
-
171
-
172
-
173
-
174
-
175
-
176
-
177
-
178
-
179
-
180
-
181
-
182
-
183
-
184
-
185
-
186
-
187
-
188
-
189
-
190
-
191
-
192
-
193
-
194
-
195
-
196
-
197
-
198
-
199
-
200
-
201
-
202
-
203
-
204
-
205
-
206
-
207
-
208
-
209
-
210
-
211
-
212
-
213
-
214
-
215
-
216
-
217
-
218
-
219
-
220
-
221
-
222
-
223
-
224
-
225
-
226
-
227
-
228
-
229
-
230
-
231
-
232
-
233
-
234
-
235
-
236
-
237
-
238
-
239
-
240
-
241
-
242
-
243
-
244
-
245
-
246
-
247
-
248
-
249
-
250
-
251
-
252
-
253
-
254
-
255
-
256
-
257
-
258
-
259
-
260
-
261
-
262
-
263
-
264
-
265
-
266
-
267
-
268
-
269
-
270
-
271
-
272
-
273
-
274
-
275
-
276
-
277
-
278
-
279
-
280
-
281
-
282
-
283
-
284
-
285
-
286
-
287
-
288
-
289
-
290
-
291
-
292
-
293
-
294
-
295
-
296
-
297
-
298
-
299
-
300
-
301
-
302
-
303
-
304
-
305
-
306
-
307
-
308
-
309
-
310
-
311
-
312
-
313
-
314
-
315
-
316
-
317
-
318
-
319
-
320
-
321
-
322
-
323
-
324
-
325
-
326
-
327
-
328
-
329
-
330
-
331
-
332
-
333
-
334
-
335
-
336
-
337
-
338
-
339
-
340
-
341
-
342
-
343
-
344
-
345
-
346
-
347
-
348
-
349
-
350
-
351
-
352
-
353
-
354
-
355
-
356
-
357
-
358
-
359
-
360
-
361
-
362
-
363
-
364
-
365
-
366
-
367
-
368
-
369
-
370
-
371
-
372
-
373
-
374
-
375
-
376
-
377
-
378
-
379
-
380
-
381
-
382
-
383
-
384
-
385
-
386
-
387
-
388
-
389
-
390
-
391
-
392
-
393
-
394
-
395
-
396
-
397
-
398
-
399
-
400
-
401
 |
 |

Table of Contents
US Airways, Inc.
Notes to Consolidated Financial Statements — (Continued)
During the second quarter of 2008, US Airways performed the first step of the two-step impairment test and compared the fair value
of the mainline reporting unit to its carrying value. Consistent with US Airways' approach in its annual impairment testing, in assessing
the fair value of the reporting unit, US Airways considered both the market approach and income approach. Under the market approach,
the fair value of the reporting unit is based on quoted market prices and the number of shares outstanding for US Airways Group's
common stock. Under the income approach, the fair value of the reporting unit is based on the present value of estimated future cash
flows. The income approach is dependent on a number of significant management assumptions, including estimates of future capacity,
passenger yield, traffic, fuel, other operating costs and discount rates. Due to current market conditions, greater weighting was attributed
to the market approach, which was weighted 67% while the income approach was weighted 33% in arriving at the fair value of the
reporting unit. US Airways determined that the fair value of the mainline reporting unit was less than the carrying value of the net assets
of the reporting unit, and thus US Airways performed step two of the impairment test.
In step two of the impairment test, US Airways determined the implied fair value of the goodwill and compared it to the carrying
value of the goodwill. US Airways allocated the fair value of the reporting unit to all of its assets and liabilities as if the reporting unit had
been acquired in a business combination and the fair value of the mainline reporting unit was the price paid to acquire the reporting unit.
The excess of the fair value of the reporting unit over the amounts assigned to its assets and liabilities is the implied fair value of
goodwill. US Airways' step two analysis resulted in no implied fair value of goodwill, and therefore, US Airways recognized an
impairment charge of $622 million in the second quarter of 2008, representing a write off of the entire amount of US Airways' previously
recorded goodwill.
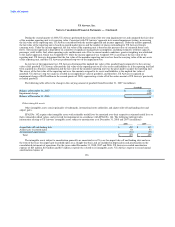
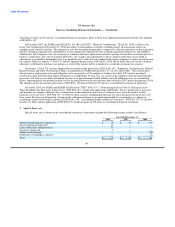
The following table reflects the change in the carrying amount of goodwill from December 31, 2007 (in millions):
Goodwill
Balance at December 31, 2007 $ 622
Impairment charge (622)
Balance at December 31, 2008 $ —
Other intangible assets
Other intangible assets consist primarily of trademarks, international route authorities and airport take-off and landing slots and
airport gates.
SFAS No. 142 requires that intangible assets with estimable useful lives be amortized over their respective estimated useful lives to
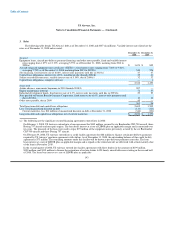
their estimated residual values, and reviewed for impairments in accordance with SFAS No. 144. The following table provides
information relating to US Airways' intangible assets subject to amortization as of December 31, 2008 and 2007 (in millions):
2008 2007
Airport take-off and landing slots $ 452 $ 435
Airport gate leasehold rights 52 52
Accumulated amortization (81) (58)
Total $ 423 $ 429
The intangible assets subject to amortization generally are amortized over 25 years for airport take-off and landing slots and over
the term of the lease for airport gate leasehold rights on a straight-line basis and are included in depreciation and amortization on the
consolidated statements of operations. For the years ended December 31, 2008, 2007 and 2006, US Airways recorded amortization
expense of $23 million, $23 million and $27 million, respectively, related to its intangible assets. US Airways expects to record annual
amortization expense of
136