US Airways 2008 Annual Report Download - page 61
Download and view the complete annual report
Please find page 61 of the 2008 US Airways annual report below. You can navigate through the pages in the report by either clicking on the pages listed below, or by using the keyword search tool below to find specific information within the annual report.-
 1
1 -
2
-
3
-
4
-
5
-
6
-
7
-
8
-
9
-
10
-
11
-
12
-
13
-
14
-
15
-
16
-
17
-
18
-
19
-
20
-
21
-
22
-
23
-
24
-
25
-
26
-
27
-
28
-
29
-
30
-
31
-
32
-
33
-
34
-
35
-
36
-
37
-
38
-
39
-
40
-
41
-
42
-
43
-
44
-
45
-
46
-
47
-
48
-
49
-
50
-
 51
51 -
 52
52 -
 53
53 -
 54
54 -
 55
55 -
 56
56 -
 57
57 -
 58
58 -
 59
59 -
 60
60 -
 61
61 -
 62
62 -
 63
63 -
 64
64 -
 65
65 -
 66
66 -
 67
67 -
 68
68 -
 69
69 -
 70
70 -
 71
71 -
72
-
73
-
74
-
75
-
76
-
77
-
78
-
79
-
80
-
81
-
82
-
83
-
84
-
85
-
86
-
87
-
88
-
89
-
90
-
91
-
92
-
93
-
94
-
95
-
96
-
97
-
98
-
99
-
100
-
101
-
102
-
103
-
104
-
105
-
106
-
107
-
108
-
109
-
110
-
111
-
112
-
113
-
114
-
115
-
116
-
117
-
118
-
119
-
120
-
121
-
122
-
123
-
124
-
125
-
126
-
127
-
128
-
129
-
130
-
131
-
132
-
133
-
134
-
135
-
136
-
137
-
138
-
139
-
140
-
141
-
142
-
143
-
144
-
145
-
146
-
147
-
148
-
149
-
150
-
151
-
152
-
153
-
154
-
155
-
156
-
157
-
158
-
159
-
160
-
161
-
162
-
163
-
164
-
165
-
166
-
167
-
168
-
169
-
170
-
171
-
172
-
173
-
174
-
175
-
176
-
177
-
178
-
179
-
180
-
181
-
182
-
183
-
184
-
185
-
186
-
187
-
188
-
189
-
190
-
191
-
192
-
193
-
194
-
195
-
196
-
197
-
198
-
199
-
200
-
201
-
202
-
203
-
204
-
205
-
206
-
207
-
208
-
209
-
210
-
211
-
212
-
213
-
214
-
215
-
216
-
217
-
218
-
219
-
220
-
221
-
222
-
223
-
224
-
225
-
226
-
227
-
228
-
229
-
230
-
231
-
232
-
233
-
234
-
235
-
236
-
237
-
238
-
239
-
240
-
241
-
242
-
243
-
244
-
245
-
246
-
247
-
248
-
249
-
250
-
251
-
252
-
253
-
254
-
255
-
256
-
257
-
258
-
259
-
260
-
261
-
262
-
263
-
264
-
265
-
266
-
267
-
268
-
269
-
270
-
271
-
272
-
273
-
274
-
275
-
276
-
277
-
278
-
279
-
280
-
281
-
282
-
283
-
284
-
285
-
286
-
287
-
288
-
289
-
290
-
291
-
292
-
293
-
294
-
295
-
296
-
297
-
298
-
299
-
300
-
301
-
302
-
303
-
304
-
305
-
306
-
307
-
308
-
309
-
310
-
311
-
312
-
313
-
314
-
315
-
316
-
317
-
318
-
319
-
320
-
321
-
322
-
323
-
324
-
325
-
326
-
327
-
328
-
329
-
330
-
331
-
332
-
333
-
334
-
335
-
336
-
337
-
338
-
339
-
340
-
341
-
342
-
343
-
344
-
345
-
346
-
347
-
348
-
349
-
350
-
351
-
352
-
353
-
354
-
355
-
356
-
357
-
358
-
359
-
360
-
361
-
362
-
363
-
364
-
365
-
366
-
367
-
368
-
369
-
370
-
371
-
372
-
373
-
374
-
375
-
376
-
377
-
378
-
379
-
380
-
381
-
382
-
383
-
384
-
385
-
386
-
387
-
388
-
389
-
390
-
391
-
392
-
393
-
394
-
395
-
396
-
397
-
398
-
399
-
400
-
401
 |
 |

Table of Contents
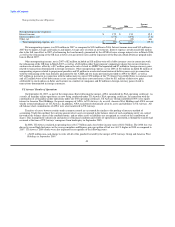
prices are generally highly correlated with those of jet fuel, the prices of jet fuel may change more or less than heating oil, resulting in a
change in fuel expense that is not fully offset by the hedge transactions. As of December 31, 2008, we estimate that a 10% increase in
heating oil futures prices would increase the fair value of the hedge transactions by approximately $30 million. We estimate that a 10%
decrease in heating oil futures prices would decrease the fair value of the hedge transactions by approximately $30 million. Since we have
not entered into any new fuel hedge transactions since the third quarter of 2008, the impact of changes in heating oil futures prices will
decrease as existing hedges are settled.
When our fuel hedging derivative instruments are in a net asset position, we are exposed to credit losses in the event of non-
performance by counterparties to our fuel hedging derivatives. The amount of such credit exposure is limited to the unrealized gains, if
any, on our fuel hedging derivatives. To manage credit risks, we carefully select counterparties, conduct transactions with multiple
counterparties which limits our exposure to any single counterparty, and monitor the market position of the program and our relative
market position with each counterparty. We also maintain industry-standard security agreements with all of our counterparties which may
require the counterparty to post collateral if the value of the fuel hedging derivatives exceeds specified thresholds related to the
counterparty's credit ratings.
When our fuel hedging derivative instruments are in a net liability position, we are exposed to credit risks related to the return of
collateral in situations in which we have posted collateral with counterparties for unrealized losses. As of December 31, 2008, we were in
a net liability position of $375 million based on the fair value of our fuel hedging derivative instruments due to the significant decline in
the price of oil in the latter part of 2008. When possible, in order to mitigate the risk of posting collateral, we provide letters of credit to
certain counterparties in lieu of cash. At December 31, 2008, $185 million related to letters of credit collateralizing certain counterparties
to our fuel hedging transactions is included in short-term restricted cash. In addition, at December 31, 2008, we had $276 million in cash
deposits held by counterparties to our fuel hedging transactions. Since the third quarter of 2008, we have not entered into any new
transactions as part of our fuel hedging program due to the impact collateral requirements could have on our liquidity resulting from the
significant decline in the price of oil and counterparty credit risk arising from global economic uncertainty.
Further declines in heating oil prices would result in additional collateral requirements with our counterparties, unrealized losses on
our existing fuel hedging derivative instruments and realized losses at the time of settlement of these fuel hedging derivative instruments.
See also Item 7A. "Quantitative and Qualitative Disclosures About Market Risk."
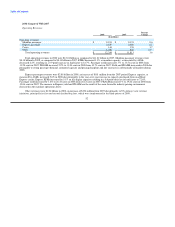
Sources and Uses of Cash
US Airways Group
2008 Compared to 2007
Net cash used in operating activities was $980 million in 2008 as compared to net cash provided by operating activities of
$451 million in 2007. The period over period decrease of $1.43 billion is due principally to our net loss for 2008, which was driven by
record high fuel prices. Our mainline and Express fuel expense, net of realized gains on fuel hedging transactions, was $1.28 billion
higher in 2008 than in 2007 on slightly lower capacity. Additionally, the substantial decrease in the price of fuel in the latter part of 2008,
while a significant positive development, had the near term liquidity impact of reducing our operating cash flow by $461 million as we
were required to post collateral in the form of cash deposits and letters of credit we issued in connection with no premium collars entered
into as part of our fuel hedging program. This compares to the same period in 2007 when we received the return of fuel hedging collateral
of $48 million from our counterparties. The increase in fuel costs and fuel hedge collateral was partially offset by an increase in revenue
of $418 million due to a 3.1% increase in mainline and Express PRASM and our new revenue initiatives that went into effect in 2008.
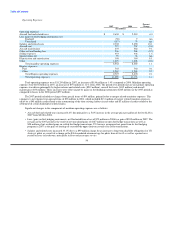
Net cash used in investing activities was $915 million in 2008 as compared to net cash provided by investing activities of
$269 million in 2007. Principal investing activities in 2008 included expenditures for property and equipment totaling $929 million,
including the purchase of 14 Embraer 190 aircraft and five Airbus A321 aircraft, a $139 million increase in equipment purchase deposits
for certain aircraft on order and a $74 million increase in
59