US Airways 2008 Annual Report Download - page 87
Download and view the complete annual report
Please find page 87 of the 2008 US Airways annual report below. You can navigate through the pages in the report by either clicking on the pages listed below, or by using the keyword search tool below to find specific information within the annual report.-
 1
1 -
2
-
3
-
4
-
5
-
6
-
7
-
8
-
9
-
10
-
11
-
12
-
13
-
14
-
15
-
16
-
17
-
18
-
19
-
20
-
21
-
22
-
23
-
24
-
25
-
26
-
27
-
28
-
29
-
30
-
31
-
32
-
33
-
34
-
35
-
36
-
37
-
38
-
39
-
40
-
41
-
42
-
43
-
44
-
45
-
46
-
47
-
48
-
49
-
50
-
51
-
52
-
53
-
54
-
55
-
56
-
57
-
58
-
59
-
60
-
61
-
62
-
63
-
64
-
65
-
66
-
67
-
68
-
69
-
70
-
71
-
72
-
73
-
74
-
75
-
76
-
 77
77 -
 78
78 -
 79
79 -
 80
80 -
 81
81 -
 82
82 -
 83
83 -
 84
84 -
 85
85 -
 86
86 -
 87
87 -
 88
88 -
 89
89 -
 90
90 -
 91
91 -
 92
92 -
 93
93 -
 94
94 -
 95
95 -
 96
96 -
 97
97 -
98
-
99
-
100
-
101
-
102
-
103
-
104
-
105
-
106
-
107
-
108
-
109
-
110
-
111
-
112
-
113
-
114
-
115
-
116
-
117
-
118
-
119
-
120
-
121
-
122
-
123
-
124
-
125
-
126
-
127
-
128
-
129
-
130
-
131
-
132
-
133
-
134
-
135
-
136
-
137
-
138
-
139
-
140
-
141
-
142
-
143
-
144
-
145
-
146
-
147
-
148
-
149
-
150
-
151
-
152
-
153
-
154
-
155
-
156
-
157
-
158
-
159
-
160
-
161
-
162
-
163
-
164
-
165
-
166
-
167
-
168
-
169
-
170
-
171
-
172
-
173
-
174
-
175
-
176
-
177
-
178
-
179
-
180
-
181
-
182
-
183
-
184
-
185
-
186
-
187
-
188
-
189
-
190
-
191
-
192
-
193
-
194
-
195
-
196
-
197
-
198
-
199
-
200
-
201
-
202
-
203
-
204
-
205
-
206
-
207
-
208
-
209
-
210
-
211
-
212
-
213
-
214
-
215
-
216
-
217
-
218
-
219
-
220
-
221
-
222
-
223
-
224
-
225
-
226
-
227
-
228
-
229
-
230
-
231
-
232
-
233
-
234
-
235
-
236
-
237
-
238
-
239
-
240
-
241
-
242
-
243
-
244
-
245
-
246
-
247
-
248
-
249
-
250
-
251
-
252
-
253
-
254
-
255
-
256
-
257
-
258
-
259
-
260
-
261
-
262
-
263
-
264
-
265
-
266
-
267
-
268
-
269
-
270
-
271
-
272
-
273
-
274
-
275
-
276
-
277
-
278
-
279
-
280
-
281
-
282
-
283
-
284
-
285
-
286
-
287
-
288
-
289
-
290
-
291
-
292
-
293
-
294
-
295
-
296
-
297
-
298
-
299
-
300
-
301
-
302
-
303
-
304
-
305
-
306
-
307
-
308
-
309
-
310
-
311
-
312
-
313
-
314
-
315
-
316
-
317
-
318
-
319
-
320
-
321
-
322
-
323
-
324
-
325
-
326
-
327
-
328
-
329
-
330
-
331
-
332
-
333
-
334
-
335
-
336
-
337
-
338
-
339
-
340
-
341
-
342
-
343
-
344
-
345
-
346
-
347
-
348
-
349
-
350
-
351
-
352
-
353
-
354
-
355
-
356
-
357
-
358
-
359
-
360
-
361
-
362
-
363
-
364
-
365
-
366
-
367
-
368
-
369
-
370
-
371
-
372
-
373
-
374
-
375
-
376
-
377
-
378
-
379
-
380
-
381
-
382
-
383
-
384
-
385
-
386
-
387
-
388
-
389
-
390
-
391
-
392
-
393
-
394
-
395
-
396
-
397
-
398
-
399
-
400
-
401
 |
 |
Table of Contents
US Airways Group, Inc.
Notes to Consolidated Financial Statements — (Continued)
Certain prior year amounts have been reclassified to conform with the 2008 presentation.
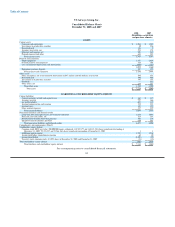
(c) Cash and Cash Equivalents
Cash equivalents consist primarily of cash in money market securities and highly liquid debt instruments. All highly liquid
investments purchased within three months of maturity are classified as cash equivalents. Cash equivalents are stated at cost, which
approximates fair value due to the highly liquid nature and short-term maturities of the underlying securities.
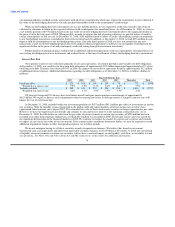
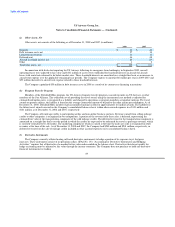
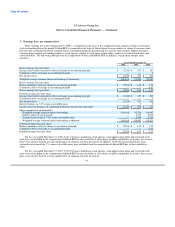
As of December 31, 2008 and 2007, the Company's cash and cash equivalents are as follows (in millions):
2008 2007
Cash and money market funds $ 1,024 $ 1,858
Corporate bonds 10 90
Total cash and cash equivalents $ 1,034 $ 1,948
(d) Investments in Marketable Securities
All highly liquid investments with maturities greater than three months but less than one year are classified as current investments in
marketable securities. Investments in marketable securities classified as noncurrent assets on the Company's balance sheet represent
investments expected to be converted to cash after 12 months. Debt securities, other than auction rate securities, are classified as held to
maturity in accordance with Statement of Financial Accounting Standards ("SFAS") No. 115, "Accounting for Certain Investments in
Debt and Equity Securities." Held to maturity investments are carried at amortized cost, which approximates fair value. Investments in
auction rate securities are classified as available for sale and recorded at fair value.
As of December 31, 2008 and 2007, the Company's investments in marketable securities are classified as follows (in millions):
2008 2007
Held to maturity securities:
Corporate bonds $ 20 $ 125
U.S. government sponsored enterprises — 81
Certificates of deposit — 20
Total investments in marketable securities-current $ 20 $ 226
Available for sale securities:
Auction rate securities 187 353
Total investments in marketable securities-noncurrent $ 187 $ 353
See Note 6(b) for more information on the Company's investments in marketable securities.
(e) Restricted Cash
Restricted cash includes deposits in trust accounts primarily to fund certain taxes and fees and workers' compensation claims,
deposits securing certain letters of credit and surety bonds and deposits held by institutions that process credit card sales transactions.
Restricted cash is stated at cost, which approximates fair value.
85