US Airways 2008 Annual Report Download - page 71
Download and view the complete annual report
Please find page 71 of the 2008 US Airways annual report below. You can navigate through the pages in the report by either clicking on the pages listed below, or by using the keyword search tool below to find specific information within the annual report.-
 1
1 -
2
-
3
-
4
-
5
-
6
-
7
-
8
-
9
-
10
-
11
-
12
-
13
-
14
-
15
-
16
-
17
-
18
-
19
-
20
-
21
-
22
-
23
-
24
-
25
-
26
-
27
-
28
-
29
-
30
-
31
-
32
-
33
-
34
-
35
-
36
-
37
-
38
-
39
-
40
-
41
-
42
-
43
-
44
-
45
-
46
-
47
-
48
-
49
-
50
-
51
-
52
-
53
-
54
-
55
-
56
-
57
-
58
-
59
-
60
-
 61
61 -
 62
62 -
 63
63 -
 64
64 -
 65
65 -
 66
66 -
 67
67 -
 68
68 -
 69
69 -
 70
70 -
 71
71 -
 72
72 -
 73
73 -
 74
74 -
 75
75 -
 76
76 -
 77
77 -
 78
78 -
 79
79 -
 80
80 -
 81
81 -
82
-
83
-
84
-
85
-
86
-
87
-
88
-
89
-
90
-
91
-
92
-
93
-
94
-
95
-
96
-
97
-
98
-
99
-
100
-
101
-
102
-
103
-
104
-
105
-
106
-
107
-
108
-
109
-
110
-
111
-
112
-
113
-
114
-
115
-
116
-
117
-
118
-
119
-
120
-
121
-
122
-
123
-
124
-
125
-
126
-
127
-
128
-
129
-
130
-
131
-
132
-
133
-
134
-
135
-
136
-
137
-
138
-
139
-
140
-
141
-
142
-
143
-
144
-
145
-
146
-
147
-
148
-
149
-
150
-
151
-
152
-
153
-
154
-
155
-
156
-
157
-
158
-
159
-
160
-
161
-
162
-
163
-
164
-
165
-
166
-
167
-
168
-
169
-
170
-
171
-
172
-
173
-
174
-
175
-
176
-
177
-
178
-
179
-
180
-
181
-
182
-
183
-
184
-
185
-
186
-
187
-
188
-
189
-
190
-
191
-
192
-
193
-
194
-
195
-
196
-
197
-
198
-
199
-
200
-
201
-
202
-
203
-
204
-
205
-
206
-
207
-
208
-
209
-
210
-
211
-
212
-
213
-
214
-
215
-
216
-
217
-
218
-
219
-
220
-
221
-
222
-
223
-
224
-
225
-
226
-
227
-
228
-
229
-
230
-
231
-
232
-
233
-
234
-
235
-
236
-
237
-
238
-
239
-
240
-
241
-
242
-
243
-
244
-
245
-
246
-
247
-
248
-
249
-
250
-
251
-
252
-
253
-
254
-
255
-
256
-
257
-
258
-
259
-
260
-
261
-
262
-
263
-
264
-
265
-
266
-
267
-
268
-
269
-
270
-
271
-
272
-
273
-
274
-
275
-
276
-
277
-
278
-
279
-
280
-
281
-
282
-
283
-
284
-
285
-
286
-
287
-
288
-
289
-
290
-
291
-
292
-
293
-
294
-
295
-
296
-
297
-
298
-
299
-
300
-
301
-
302
-
303
-
304
-
305
-
306
-
307
-
308
-
309
-
310
-
311
-
312
-
313
-
314
-
315
-
316
-
317
-
318
-
319
-
320
-
321
-
322
-
323
-
324
-
325
-
326
-
327
-
328
-
329
-
330
-
331
-
332
-
333
-
334
-
335
-
336
-
337
-
338
-
339
-
340
-
341
-
342
-
343
-
344
-
345
-
346
-
347
-
348
-
349
-
350
-
351
-
352
-
353
-
354
-
355
-
356
-
357
-
358
-
359
-
360
-
361
-
362
-
363
-
364
-
365
-
366
-
367
-
368
-
369
-
370
-
371
-
372
-
373
-
374
-
375
-
376
-
377
-
378
-
379
-
380
-
381
-
382
-
383
-
384
-
385
-
386
-
387
-
388
-
389
-
390
-
391
-
392
-
393
-
394
-
395
-
396
-
397
-
398
-
399
-
400
-
401
 |
 |

Table of Contents
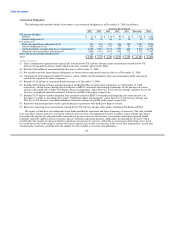
Moreover, the Citicorp credit facility, our amended credit card agreement with Barclays and certain of our other financing arrangements
contain minimum cash balance requirements. As a result, we cannot use all of our available cash to fund operations, capital expenditures
and cash obligations without violating these requirements.
Critical Accounting Policies and Estimates
The preparation of our consolidated financial statements in accordance with accounting principles generally accepted in the United
States requires that we make certain estimates and assumptions that affect the reported amount of assets and liabilities, revenues and
expenses, and the disclosure of contingent assets and liabilities at the date of our financial statements. We believe our estimates and
assumptions are reasonable; however, actual results could differ from those estimates. Critical accounting policies are defined as those
that are reflective of significant judgments and uncertainties and potentially result in materially different results under different
assumptions and conditions. We have identified the following critical accounting policies that impact the preparation of our consolidated
financial statements. See also the summary of significant accounting policies included in the notes to the financial statements under
Items 8A and 8B of this Form 10-K for additional discussion of the application of these estimates and other accounting policies.
Passenger Revenue
Passenger revenue is recognized when transportation is provided. Ticket sales for transportation that has not yet been provided are
initially deferred and recorded as air traffic liability on the balance sheet. The air traffic liability represents tickets sold for future travel
dates and estimated future refunds and exchanges of tickets sold for past travel dates. The balance in the air traffic liability fluctuates
throughout the year based on seasonal travel patterns and fare sale activity. Our air traffic liability was $698 million and $832 million as
of December 31, 2008 and 2007, respectively.
The majority of our tickets sold are nonrefundable. A small percentage of tickets, some of which are partially used tickets, expire
unused. Due to complex pricing structures, refund and exchange policies, and interline agreements with other airlines, certain amounts
are recognized in revenue using estimates regarding both the timing of the revenue recognition and the amount of revenue to be
recognized. These estimates are generally based on the analysis of our historical data. We routinely evaluate estimated future refunds and
exchanges included in the air traffic liability based on subsequent activity to validate the accuracy of our estimates. Holding other factors
constant, a 10% change in our estimate of the amount refunded, exchanged or forfeited for 2008 would result in a $38 million change in
our passenger revenue, which represents less than 1% of our passenger revenue.
Passenger traffic commissions and related fees are expensed when the related revenue is recognized. Passenger traffic commissions
and related fees not yet recognized are included as a prepaid expense.
Impairment of Goodwill
SFAS No. 142, "Goodwill and Other Intangible Assets," requires that goodwill be tested for impairment at the reporting unit level
on an annual basis and between annual tests if an event occurs or circumstances change that would more likely than not reduce the fair
value of the reporting unit below its carrying value. Goodwill represents the purchase price in excess of the net amount assigned to assets
acquired and liabilities assumed by America West Holdings on September 27, 2005. We have two reporting units consisting of our
mainline and Express operations. All of our goodwill was allocated to the mainline reporting unit.
In accordance with SFAS No. 142, we concluded that events had occurred and circumstances had changed during the second
quarter of 2008 which required us to perform an interim period goodwill impairment test. Subsequent to the first quarter of 2008, we
experienced a significant decline in market capitalization due to overall airline industry conditions driven by record high fuel prices. The
price of fuel became less volatile in the second quarter of 2008, and there was a sustained surge in fuel prices. On May 21, 2008, the price
per barrel of oil hit a then record high of $133 per barrel and from that date through June 30, 2008 stayed at an average daily price of
$133 per barrel. Our average mainline fuel price during the second quarter of 2008 was $3.63 as compared to $2.88 per gallon in the first
quarter of 2008 and $2.20 for the full year 2007. This increase in the price per gallon of fuel represented an increase of 26% and 65% as
compared to the first quarter of 2008 and full year 2007, respectively. Our average
69