US Airways 2008 Annual Report Download - page 121
Download and view the complete annual report
Please find page 121 of the 2008 US Airways annual report below. You can navigate through the pages in the report by either clicking on the pages listed below, or by using the keyword search tool below to find specific information within the annual report.-
 1
1 -
2
-
3
-
4
-
5
-
6
-
7
-
8
-
9
-
10
-
11
-
12
-
13
-
14
-
15
-
16
-
17
-
18
-
19
-
20
-
21
-
22
-
23
-
24
-
25
-
26
-
27
-
28
-
29
-
30
-
31
-
32
-
33
-
34
-
35
-
36
-
37
-
38
-
39
-
40
-
41
-
42
-
43
-
44
-
45
-
46
-
47
-
48
-
49
-
50
-
51
-
52
-
53
-
54
-
55
-
56
-
57
-
58
-
59
-
60
-
61
-
62
-
63
-
64
-
65
-
66
-
67
-
68
-
69
-
70
-
71
-
72
-
73
-
74
-
75
-
76
-
77
-
78
-
79
-
80
-
81
-
82
-
83
-
84
-
85
-
86
-
87
-
88
-
89
-
90
-
91
-
92
-
93
-
94
-
95
-
96
-
97
-
98
-
99
-
100
-
101
-
102
-
103
-
104
-
105
-
106
-
107
-
108
-
109
-
110
-
 111
111 -
 112
112 -
 113
113 -
 114
114 -
 115
115 -
 116
116 -
 117
117 -
 118
118 -
 119
119 -
 120
120 -
 121
121 -
 122
122 -
 123
123 -
 124
124 -
 125
125 -
 126
126 -
 127
127 -
 128
128 -
 129
129 -
 130
130 -
 131
131 -
132
-
133
-
134
-
135
-
136
-
137
-
138
-
139
-
140
-
141
-
142
-
143
-
144
-
145
-
146
-
147
-
148
-
149
-
150
-
151
-
152
-
153
-
154
-
155
-
156
-
157
-
158
-
159
-
160
-
161
-
162
-
163
-
164
-
165
-
166
-
167
-
168
-
169
-
170
-
171
-
172
-
173
-
174
-
175
-
176
-
177
-
178
-
179
-
180
-
181
-
182
-
183
-
184
-
185
-
186
-
187
-
188
-
189
-
190
-
191
-
192
-
193
-
194
-
195
-
196
-
197
-
198
-
199
-
200
-
201
-
202
-
203
-
204
-
205
-
206
-
207
-
208
-
209
-
210
-
211
-
212
-
213
-
214
-
215
-
216
-
217
-
218
-
219
-
220
-
221
-
222
-
223
-
224
-
225
-
226
-
227
-
228
-
229
-
230
-
231
-
232
-
233
-
234
-
235
-
236
-
237
-
238
-
239
-
240
-
241
-
242
-
243
-
244
-
245
-
246
-
247
-
248
-
249
-
250
-
251
-
252
-
253
-
254
-
255
-
256
-
257
-
258
-
259
-
260
-
261
-
262
-
263
-
264
-
265
-
266
-
267
-
268
-
269
-
270
-
271
-
272
-
273
-
274
-
275
-
276
-
277
-
278
-
279
-
280
-
281
-
282
-
283
-
284
-
285
-
286
-
287
-
288
-
289
-
290
-
291
-
292
-
293
-
294
-
295
-
296
-
297
-
298
-
299
-
300
-
301
-
302
-
303
-
304
-
305
-
306
-
307
-
308
-
309
-
310
-
311
-
312
-
313
-
314
-
315
-
316
-
317
-
318
-
319
-
320
-
321
-
322
-
323
-
324
-
325
-
326
-
327
-
328
-
329
-
330
-
331
-
332
-
333
-
334
-
335
-
336
-
337
-
338
-
339
-
340
-
341
-
342
-
343
-
344
-
345
-
346
-
347
-
348
-
349
-
350
-
351
-
352
-
353
-
354
-
355
-
356
-
357
-
358
-
359
-
360
-
361
-
362
-
363
-
364
-
365
-
366
-
367
-
368
-
369
-
370
-
371
-
372
-
373
-
374
-
375
-
376
-
377
-
378
-
379
-
380
-
381
-
382
-
383
-
384
-
385
-
386
-
387
-
388
-
389
-
390
-
391
-
392
-
393
-
394
-
395
-
396
-
397
-
398
-
399
-
400
-
401
 |
 |

Table of Contents
US Airways Group, Inc.
Notes to Consolidated Financial Statements — (Continued)
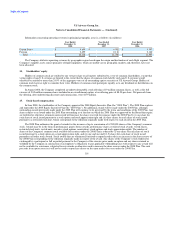
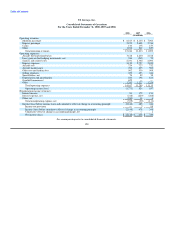
The Company's net income (loss) for the years ended December 31, 2008, 2007 and 2006 includes $34 million, $32 million and
$34 million, respectively, of compensation costs related to share-based payments. Upon adoption of SFAS No. 123R, "Share-Based
Payment," the Company recorded a cumulative benefit from the accounting change of $1 million, which reflects the impact of estimating
future forfeitures for previously recognized compensation expense. No income tax effect related to share-based payments or cumulative
effect has been recorded as the effects have been immediately offset by the recording of a valuation allowance through the same financial
statement caption.
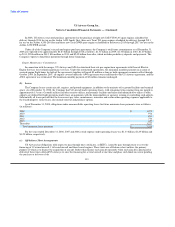
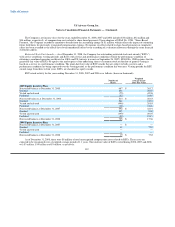
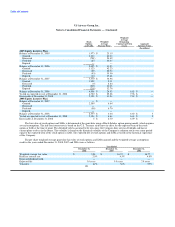
Restricted Stock Unit Awards — As of December 31, 2008, the Company has outstanding restricted stock unit awards ("RSUs")
with service conditions (vesting periods) and RSUs with service and performance conditions (which the performance condition of
obtaining a combined operating certificate for AWA and US Airways was met on September 26, 2007). SFAS No. 123R requires that the
grant-date fair value of RSUs be equal to the market price of the underlying shares of common stock on the date of grant if vesting is
based on a service or a performance condition. The grant-date fair value of RSU awards that are subject to both a service and a
performance condition are being expensed over the vesting period, as the performance condition has been met. Vesting periods for RSU
awards range from three to four years. RSUs are classified as equity awards.
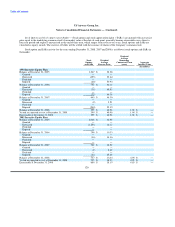
RSU award activity for the years ending December 31, 2008, 2007 and 2006 is as follows (shares in thousands):
Weighted
Number of Average Grant-
Shares Date Fair Value
2005 Equity Incentive Plan
Nonvested balance at December 31, 2005 687 $ 26.17
Granted 254 38.55
Vested and released (75) 42.38
Forfeited (52) 24.85
Nonvested balances at December 31, 2006 814 $ 28.63
Granted 242 41.51
Vested and released (446) 29.85
Forfeited (18) 31.26
Nonvested balance at December 31, 2007 592 $ 32.91
Granted 535 9.02
Vested and released (390) 29.07
Forfeited (32) 23.15
Nonvested balance at December 31, 2008 705 $ 17.36
2008 Equity Incentive Plan
Nonvested balance at December 31, 2007 — $ —
Granted 19 7.52
Vested and released — —
Forfeited — —
Nonvested balance at December 31, 2008 19 $ 7.52
As of December 31, 2008, there were $8 million of total unrecognized compensation costs related to RSUs. These costs are
expected to be recognized over a weighted average period of 1.1 years. The total fair value of RSUs vested during 2008, 2007 and 2006
was $3 million, $14 million and $3 million, respectively.
119