US Airways 2008 Annual Report Download - page 155
Download and view the complete annual report
Please find page 155 of the 2008 US Airways annual report below. You can navigate through the pages in the report by either clicking on the pages listed below, or by using the keyword search tool below to find specific information within the annual report.-
 1
1 -
2
-
3
-
4
-
5
-
6
-
7
-
8
-
9
-
10
-
11
-
12
-
13
-
14
-
15
-
16
-
17
-
18
-
19
-
20
-
21
-
22
-
23
-
24
-
25
-
26
-
27
-
28
-
29
-
30
-
31
-
32
-
33
-
34
-
35
-
36
-
37
-
38
-
39
-
40
-
41
-
42
-
43
-
44
-
45
-
46
-
47
-
48
-
49
-
50
-
51
-
52
-
53
-
54
-
55
-
56
-
57
-
58
-
59
-
60
-
61
-
62
-
63
-
64
-
65
-
66
-
67
-
68
-
69
-
70
-
71
-
72
-
73
-
74
-
75
-
76
-
77
-
78
-
79
-
80
-
81
-
82
-
83
-
84
-
85
-
86
-
87
-
88
-
89
-
90
-
91
-
92
-
93
-
94
-
95
-
96
-
97
-
98
-
99
-
100
-
101
-
102
-
103
-
104
-
105
-
106
-
107
-
108
-
109
-
110
-
111
-
112
-
113
-
114
-
115
-
116
-
117
-
118
-
119
-
120
-
121
-
122
-
123
-
124
-
125
-
126
-
127
-
128
-
129
-
130
-
131
-
132
-
133
-
134
-
135
-
136
-
137
-
138
-
139
-
140
-
141
-
142
-
143
-
144
-
 145
145 -
 146
146 -
 147
147 -
 148
148 -
 149
149 -
 150
150 -
 151
151 -
 152
152 -
 153
153 -
 154
154 -
 155
155 -
 156
156 -
 157
157 -
 158
158 -
 159
159 -
 160
160 -
 161
161 -
 162
162 -
 163
163 -
 164
164 -
 165
165 -
166
-
167
-
168
-
169
-
170
-
171
-
172
-
173
-
174
-
175
-
176
-
177
-
178
-
179
-
180
-
181
-
182
-
183
-
184
-
185
-
186
-
187
-
188
-
189
-
190
-
191
-
192
-
193
-
194
-
195
-
196
-
197
-
198
-
199
-
200
-
201
-
202
-
203
-
204
-
205
-
206
-
207
-
208
-
209
-
210
-
211
-
212
-
213
-
214
-
215
-
216
-
217
-
218
-
219
-
220
-
221
-
222
-
223
-
224
-
225
-
226
-
227
-
228
-
229
-
230
-
231
-
232
-
233
-
234
-
235
-
236
-
237
-
238
-
239
-
240
-
241
-
242
-
243
-
244
-
245
-
246
-
247
-
248
-
249
-
250
-
251
-
252
-
253
-
254
-
255
-
256
-
257
-
258
-
259
-
260
-
261
-
262
-
263
-
264
-
265
-
266
-
267
-
268
-
269
-
270
-
271
-
272
-
273
-
274
-
275
-
276
-
277
-
278
-
279
-
280
-
281
-
282
-
283
-
284
-
285
-
286
-
287
-
288
-
289
-
290
-
291
-
292
-
293
-
294
-
295
-
296
-
297
-
298
-
299
-
300
-
301
-
302
-
303
-
304
-
305
-
306
-
307
-
308
-
309
-
310
-
311
-
312
-
313
-
314
-
315
-
316
-
317
-
318
-
319
-
320
-
321
-
322
-
323
-
324
-
325
-
326
-
327
-
328
-
329
-
330
-
331
-
332
-
333
-
334
-
335
-
336
-
337
-
338
-
339
-
340
-
341
-
342
-
343
-
344
-
345
-
346
-
347
-
348
-
349
-
350
-
351
-
352
-
353
-
354
-
355
-
356
-
357
-
358
-
359
-
360
-
361
-
362
-
363
-
364
-
365
-
366
-
367
-
368
-
369
-
370
-
371
-
372
-
373
-
374
-
375
-
376
-
377
-
378
-
379
-
380
-
381
-
382
-
383
-
384
-
385
-
386
-
387
-
388
-
389
-
390
-
391
-
392
-
393
-
394
-
395
-
396
-
397
-
398
-
399
-
400
-
401
 |
 |

Table of Contents
US Airways, Inc.
Notes to Consolidated Financial Statements — (Continued)
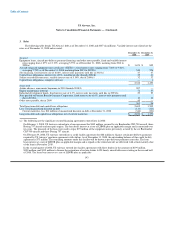
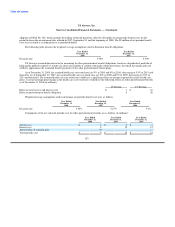
adoption of SFAS No. 158, which includes $6 million of benefit payments, offset by $2 million of net periodic benefit costs for the
period between the measurement date utilized in 2007, September 30, and the beginning of 2008. The $2 million of net periodic benefit
costs was recorded as an adjustment to accumulated deficit.
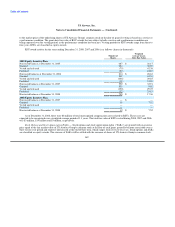
The following table presents the weighted average assumptions used to determine benefit obligations:
Year Ended Year Ended
December 31, December 31,
2008 2007
Discount rate 5.98% 5.94%
US Airways assumed discount rates for measuring its other postretirement benefit obligations, based on a hypothetical portfolio of
high quality publicly traded U.S. bonds (Aa rated, non-callable or callable with make-whole provisions), for which the timing and cash
outflows approximate the estimated benefit payments of the other postretirement benefit plans.
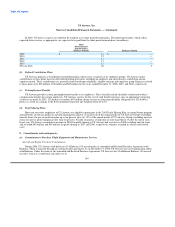
As of December 31, 2008, the assumed health care cost trend rates are 9% in 2009 and 8% in 2010, decreasing to 5.5% in 2015 and
thereafter. As of September 30, 2007, the assumed health care cost trend rates are 10% in 2008 and 9% in 2009, decreasing to 5.5% in
2013 and thereafter. The assumed health care cost trend rates could have a significant effect on amounts reported for retiree health care
plans. A one-percentage point change in the health care cost trend rates would have the following effects on other postretirement benefits
as of December 31, 2008 (in millions):
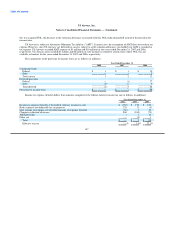
1% Increase 1% Decrease
Effect on total service and interest costs $ 1 $ (1)
Effect on postretirement benefit obligation 6 (5)
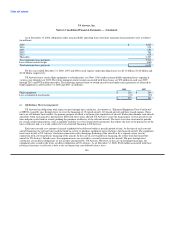
Weighted average assumptions used to determine net periodic benefit cost were as follows:
Year Ended Year Ended Year Ended
December 31, December 31, December 31,
2008 2007 2006
Discount rate 5.94% 5.67% 5.3%
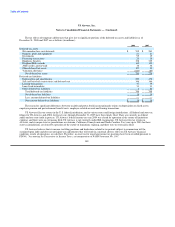
Components of the net and total periodic cost for other postretirement benefits are as follows (in millions):
Year Ended Year Ended Year Ended
December 31, December 31, December 31,
2008 2007 2006
Service cost $ 2 $ 3 $ 3
Interest cost 9 12 12
Amortization of actuarial gain (2) — —
Total periodic cost $ 9 $ 15 $ 15
153