US Airways 2008 Annual Report Download - page 51
Download and view the complete annual report
Please find page 51 of the 2008 US Airways annual report below. You can navigate through the pages in the report by either clicking on the pages listed below, or by using the keyword search tool below to find specific information within the annual report.-
 1
1 -
2
-
3
-
4
-
5
-
6
-
7
-
8
-
9
-
10
-
11
-
12
-
13
-
14
-
15
-
16
-
17
-
18
-
19
-
20
-
21
-
22
-
23
-
24
-
25
-
26
-
27
-
28
-
29
-
30
-
31
-
32
-
33
-
34
-
35
-
36
-
37
-
38
-
39
-
40
-
 41
41 -
 42
42 -
 43
43 -
 44
44 -
 45
45 -
 46
46 -
 47
47 -
 48
48 -
 49
49 -
 50
50 -
 51
51 -
 52
52 -
 53
53 -
 54
54 -
 55
55 -
 56
56 -
 57
57 -
 58
58 -
 59
59 -
 60
60 -
 61
61 -
62
-
63
-
64
-
65
-
66
-
67
-
68
-
69
-
70
-
71
-
72
-
73
-
74
-
75
-
76
-
77
-
78
-
79
-
80
-
81
-
82
-
83
-
84
-
85
-
86
-
87
-
88
-
89
-
90
-
91
-
92
-
93
-
94
-
95
-
96
-
97
-
98
-
99
-
100
-
101
-
102
-
103
-
104
-
105
-
106
-
107
-
108
-
109
-
110
-
111
-
112
-
113
-
114
-
115
-
116
-
117
-
118
-
119
-
120
-
121
-
122
-
123
-
124
-
125
-
126
-
127
-
128
-
129
-
130
-
131
-
132
-
133
-
134
-
135
-
136
-
137
-
138
-
139
-
140
-
141
-
142
-
143
-
144
-
145
-
146
-
147
-
148
-
149
-
150
-
151
-
152
-
153
-
154
-
155
-
156
-
157
-
158
-
159
-
160
-
161
-
162
-
163
-
164
-
165
-
166
-
167
-
168
-
169
-
170
-
171
-
172
-
173
-
174
-
175
-
176
-
177
-
178
-
179
-
180
-
181
-
182
-
183
-
184
-
185
-
186
-
187
-
188
-
189
-
190
-
191
-
192
-
193
-
194
-
195
-
196
-
197
-
198
-
199
-
200
-
201
-
202
-
203
-
204
-
205
-
206
-
207
-
208
-
209
-
210
-
211
-
212
-
213
-
214
-
215
-
216
-
217
-
218
-
219
-
220
-
221
-
222
-
223
-
224
-
225
-
226
-
227
-
228
-
229
-
230
-
231
-
232
-
233
-
234
-
235
-
236
-
237
-
238
-
239
-
240
-
241
-
242
-
243
-
244
-
245
-
246
-
247
-
248
-
249
-
250
-
251
-
252
-
253
-
254
-
255
-
256
-
257
-
258
-
259
-
260
-
261
-
262
-
263
-
264
-
265
-
266
-
267
-
268
-
269
-
270
-
271
-
272
-
273
-
274
-
275
-
276
-
277
-
278
-
279
-
280
-
281
-
282
-
283
-
284
-
285
-
286
-
287
-
288
-
289
-
290
-
291
-
292
-
293
-
294
-
295
-
296
-
297
-
298
-
299
-
300
-
301
-
302
-
303
-
304
-
305
-
306
-
307
-
308
-
309
-
310
-
311
-
312
-
313
-
314
-
315
-
316
-
317
-
318
-
319
-
320
-
321
-
322
-
323
-
324
-
325
-
326
-
327
-
328
-
329
-
330
-
331
-
332
-
333
-
334
-
335
-
336
-
337
-
338
-
339
-
340
-
341
-
342
-
343
-
344
-
345
-
346
-
347
-
348
-
349
-
350
-
351
-
352
-
353
-
354
-
355
-
356
-
357
-
358
-
359
-
360
-
361
-
362
-
363
-
364
-
365
-
366
-
367
-
368
-
369
-
370
-
371
-
372
-
373
-
374
-
375
-
376
-
377
-
378
-
379
-
380
-
381
-
382
-
383
-
384
-
385
-
386
-
387
-
388
-
389
-
390
-
391
-
392
-
393
-
394
-
395
-
396
-
397
-
398
-
399
-
400
-
401
 |
 |

Table of Contents
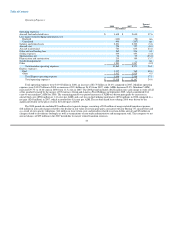
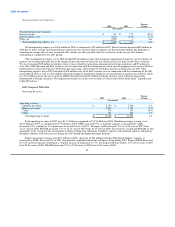
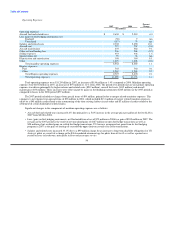
Nonoperating Income (Expense):
Percent
2007 2006 Change
(In millions)
Nonoperating income (expense):
Interest income $ 172 $ 153 12.5
Interest expense, net (273) (295) (7.5)
Other, net 2 (12) nm
Total nonoperating expense, net $ (99) $ (154) (35.7)
Net nonoperating expense was $99 million in 2007 as compared to $154 million in 2006. Interest income increased $19 million in
2007 due to higher average cash balances and higher average rates of return on investments. Interest expense, net decreased $22 million
due to the full year effect in 2007 of refinancing the loan formerly guaranteed by the ATSB at lower average interest rates in March 2006,
as well as the refinancing of the GE loan at lower average interest rates and the repayment of the Barclays Bank Delaware prepaid miles
loan in March 2007.
Other nonoperating income, net in 2007 of $2 million included an $18 million write off of debt issuance costs in connection with
the refinancing of the GE loan in March 2007 as well as a $10 million other than temporary impairment charge for our investments in
auction rate securities, offset by a $17 million gain on the sale of stock in ARINC Incorporated and $7 million in foreign currency gains
related to transactions denominated in foreign currencies. Other nonoperating expense, net in 2006 of $12 million included $6 million of
nonoperating expense related to prepayment penalties and $5 million in accelerated amortization of debt issuance costs in connection
with the refinancing of the loan formerly guaranteed by the ATSB and two loans previously provided to AWA by GECC as well as
$17 million in payments in connection with the inducement to convert $70 million of the 7% Senior Convertible Notes to common stock
and a $2 million write off of debt issuance costs associated with those converted notes, offset by $11 million of derivative gains
attributable to stock options in Sabre and warrants in a number of companies and $2 million in foreign currency gains related to
transactions denominated in foreign currencies.
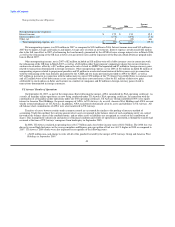
US Airways' Results of Operations
On September 26, 2007, as part of the integration efforts following the merger, AWA surrendered its FAA operating certificate. As
a result, all mainline airline operations are now being conducted under US Airways' FAA operating certificate. In connection with the
combination of all mainline airline operations under one FAA operating certificate, US Airways Group contributed 100% of its equity
interest in America West Holdings, the parent company of AWA, to US Airways. As a result, America West Holdings and AWA are now
wholly owned subsidiaries of US Airways. In addition, AWA transferred substantially all of its assets and liabilities to US Airways. All
off-balance sheet commitments of AWA were also transferred to US Airways.
Transfers of assets between entities under common control are accounted for similar to the pooling of interests method of
accounting. Under this method, the carrying amount of net assets recognized in the balance sheets of each combining entity are carried
forward to the balance sheet of the combined entity, and no other assets or liabilities are recognized as a result of the contribution of
shares. This management's discussion and analysis of financial condition and results of operations is presented as though the transfer had
occurred at the time of US Airways' emergence from bankruptcy in September 2005.
In 2008, US Airways realized an operating loss of $1.77 billion and a loss before income taxes of $2.15 billion. The 2008 loss was
driven by record high fuel prices as the average mainline and Express price per gallon of fuel was 44.1% higher in 2008 as compared to
2007. US Airways' 2008 results were also impacted by recognition of the following items:
• a $622 million non-cash charge to write off all of the goodwill created by the merger of US Airways Group and America West
Holdings in September 2005.
49