US Airways 2008 Annual Report Download - page 44
Download and view the complete annual report
Please find page 44 of the 2008 US Airways annual report below. You can navigate through the pages in the report by either clicking on the pages listed below, or by using the keyword search tool below to find specific information within the annual report.-
 1
1 -
2
-
3
-
4
-
5
-
6
-
7
-
8
-
9
-
10
-
11
-
12
-
13
-
14
-
15
-
16
-
17
-
18
-
19
-
20
-
21
-
22
-
23
-
24
-
25
-
26
-
27
-
28
-
29
-
30
-
31
-
32
-
33
-
 34
34 -
 35
35 -
 36
36 -
 37
37 -
 38
38 -
 39
39 -
 40
40 -
 41
41 -
 42
42 -
 43
43 -
 44
44 -
 45
45 -
 46
46 -
 47
47 -
 48
48 -
 49
49 -
 50
50 -
 51
51 -
 52
52 -
 53
53 -
 54
54 -
55
-
56
-
57
-
58
-
59
-
60
-
61
-
62
-
63
-
64
-
65
-
66
-
67
-
68
-
69
-
70
-
71
-
72
-
73
-
74
-
75
-
76
-
77
-
78
-
79
-
80
-
81
-
82
-
83
-
84
-
85
-
86
-
87
-
88
-
89
-
90
-
91
-
92
-
93
-
94
-
95
-
96
-
97
-
98
-
99
-
100
-
101
-
102
-
103
-
104
-
105
-
106
-
107
-
108
-
109
-
110
-
111
-
112
-
113
-
114
-
115
-
116
-
117
-
118
-
119
-
120
-
121
-
122
-
123
-
124
-
125
-
126
-
127
-
128
-
129
-
130
-
131
-
132
-
133
-
134
-
135
-
136
-
137
-
138
-
139
-
140
-
141
-
142
-
143
-
144
-
145
-
146
-
147
-
148
-
149
-
150
-
151
-
152
-
153
-
154
-
155
-
156
-
157
-
158
-
159
-
160
-
161
-
162
-
163
-
164
-
165
-
166
-
167
-
168
-
169
-
170
-
171
-
172
-
173
-
174
-
175
-
176
-
177
-
178
-
179
-
180
-
181
-
182
-
183
-
184
-
185
-
186
-
187
-
188
-
189
-
190
-
191
-
192
-
193
-
194
-
195
-
196
-
197
-
198
-
199
-
200
-
201
-
202
-
203
-
204
-
205
-
206
-
207
-
208
-
209
-
210
-
211
-
212
-
213
-
214
-
215
-
216
-
217
-
218
-
219
-
220
-
221
-
222
-
223
-
224
-
225
-
226
-
227
-
228
-
229
-
230
-
231
-
232
-
233
-
234
-
235
-
236
-
237
-
238
-
239
-
240
-
241
-
242
-
243
-
244
-
245
-
246
-
247
-
248
-
249
-
250
-
251
-
252
-
253
-
254
-
255
-
256
-
257
-
258
-
259
-
260
-
261
-
262
-
263
-
264
-
265
-
266
-
267
-
268
-
269
-
270
-
271
-
272
-
273
-
274
-
275
-
276
-
277
-
278
-
279
-
280
-
281
-
282
-
283
-
284
-
285
-
286
-
287
-
288
-
289
-
290
-
291
-
292
-
293
-
294
-
295
-
296
-
297
-
298
-
299
-
300
-
301
-
302
-
303
-
304
-
305
-
306
-
307
-
308
-
309
-
310
-
311
-
312
-
313
-
314
-
315
-
316
-
317
-
318
-
319
-
320
-
321
-
322
-
323
-
324
-
325
-
326
-
327
-
328
-
329
-
330
-
331
-
332
-
333
-
334
-
335
-
336
-
337
-
338
-
339
-
340
-
341
-
342
-
343
-
344
-
345
-
346
-
347
-
348
-
349
-
350
-
351
-
352
-
353
-
354
-
355
-
356
-
357
-
358
-
359
-
360
-
361
-
362
-
363
-
364
-
365
-
366
-
367
-
368
-
369
-
370
-
371
-
372
-
373
-
374
-
375
-
376
-
377
-
378
-
379
-
380
-
381
-
382
-
383
-
384
-
385
-
386
-
387
-
388
-
389
-
390
-
391
-
392
-
393
-
394
-
395
-
396
-
397
-
398
-
399
-
400
-
401
 |
 |
Table of Contents
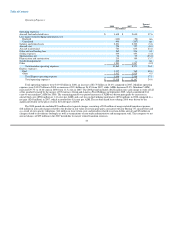
We reported a loss in 2008, which increased our net operating loss carryforwards ("NOL"), and have not recorded a tax provision
for 2008. As of December 31, 2008, we have approximately $1.49 billion of gross NOL to reduce future federal taxable income. Of this
amount, approximately $1.44 billion is available to reduce federal taxable income in the calendar year 2009. The NOL expires during the
years 2022 through 2028. Our deferred tax asset, which includes $1.41 billion of the NOL discussed above, has been subject to a full
valuation allowance. We also have approximately $77 million of tax-effected state NOL at December 31, 2008.
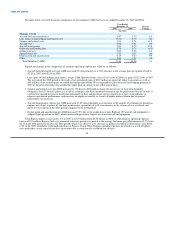
At December 31, 2008, the federal valuation allowance is $568 million, all of which will reduce future tax expense when
recognized. The state valuation allowance is $82 million, of which $58 million was established through the recognition of tax expense.
The remaining $24 million was established in purchase accounting. Effective January 1, 2009, we adopted SFAS No. 141R, "Business
Combinations." In accordance with SFAS No. 141R, all future decreases in the valuation allowance established in purchase accounting
will be recognized as a reduction in tax expense. In addition, we have $23 million and $2 million, respectively, of unrealized federal and
state tax benefit related to amounts recorded in other comprehensive income.
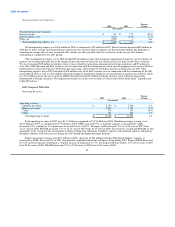
For the year ended December 31, 2007, we utilized NOL to reduce our income tax obligation. Utilization of this NOL results in a
corresponding decrease in the valuation allowance. As this valuation allowance was established through the recognition of tax expense,
the decrease in valuation allowance offsets our tax provision dollar for dollar. We recognized $7 million of non-cash state income tax
expense for the year ended December 31, 2007, as we utilized NOL that was generated by US Airways prior to the merger. As this was
acquired NOL, the decrease in the valuation allowance associated with this NOL reduced goodwill instead of the provision for income
taxes.
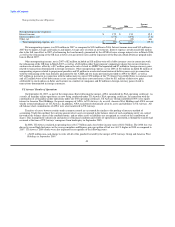
For the year ended December 31, 2006, we recognized $85 million of non-cash income tax expense, as we utilized NOL that was
generated by US Airways prior to the merger. We also recorded Alternative Minimum Tax liability ("AMT") tax expense of $10 million.
In most cases, the recognition of AMT does not result in tax expense. However, as discussed above, since our NOL was subject to a full
valuation allowance, any liability for AMT is recorded as tax expense. We also recorded $2 million of state income tax provision in 2006
related to certain states where NOL was not available to be used.
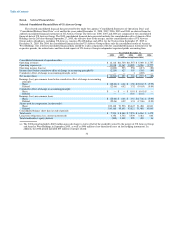
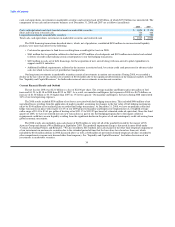
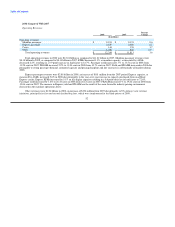
The table below sets forth our selected mainline operating data:
Percent Percent
Year Ended December 31, Change Change
2008 2007 2006 2008-2007 2007-2006
Revenue passenger miles (millions)(a) 60,570 61,262 60,689 (1.1) 0.9
Available seat miles (millions)(b) 74,151 75,842 76,983 (2.2) (1.5)
Passenger load factor (percent)(c) 81.7 80.8 78.8 0.9 pts 2.0 pts
Yield (cents)(d) 13.51 13.28 13.13 1.7 1.2
Passenger revenue per available seat mile (cents)(e) 11.04 10.73 10.35 2.9 3.7
Operating cost per available seat mile (cents)(f) 14.66 11.30 10.96 29.7 3.1
Passenger enplanements (thousands)(g) 54,820 57,871 57,345 (5.3) 0.9
Departures (thousands) 496 525 542 (5.5) (3.1)
Aircraft at end of period 354 356 359 (0.6) (0.8)
Block hours (thousands)(h) 1,300 1,343 1,365 (3.3) (1.6)
Average stage length (miles)(i) 955 925 927 3.3 (0.3)
Average passenger journey (miles)(j) 1,554 1,489 1,478 4.4 0.7
Fuel consumption (gallons in millions) 1,142 1,195 1,210 (4.4) (1.3)
Average aircraft fuel price including related taxes (dollars per gallon) 3.17 2.20 2.08 43.9 5.8
Full-time equivalent employees at end of period 32,671 34,437 34,077 (5.1) 1.1
(a) Revenue passenger mile ("RPM") — A basic measure of sales volume. A RPM represents one passenger flown one mile.
(b) Available seat mile ("ASM") — A basic measure of production. An ASM represents one seat flown one mile.
42