US Airways 2008 Annual Report Download - page 162
Download and view the complete annual report
Please find page 162 of the 2008 US Airways annual report below. You can navigate through the pages in the report by either clicking on the pages listed below, or by using the keyword search tool below to find specific information within the annual report.-
 1
1 -
2
-
3
-
4
-
5
-
6
-
7
-
8
-
9
-
10
-
11
-
12
-
13
-
14
-
15
-
16
-
17
-
18
-
19
-
20
-
21
-
22
-
23
-
24
-
25
-
26
-
27
-
28
-
29
-
30
-
31
-
32
-
33
-
34
-
35
-
36
-
37
-
38
-
39
-
40
-
41
-
42
-
43
-
44
-
45
-
46
-
47
-
48
-
49
-
50
-
51
-
52
-
53
-
54
-
55
-
56
-
57
-
58
-
59
-
60
-
61
-
62
-
63
-
64
-
65
-
66
-
67
-
68
-
69
-
70
-
71
-
72
-
73
-
74
-
75
-
76
-
77
-
78
-
79
-
80
-
81
-
82
-
83
-
84
-
85
-
86
-
87
-
88
-
89
-
90
-
91
-
92
-
93
-
94
-
95
-
96
-
97
-
98
-
99
-
100
-
101
-
102
-
103
-
104
-
105
-
106
-
107
-
108
-
109
-
110
-
111
-
112
-
113
-
114
-
115
-
116
-
117
-
118
-
119
-
120
-
121
-
122
-
123
-
124
-
125
-
126
-
127
-
128
-
129
-
130
-
131
-
132
-
133
-
134
-
135
-
136
-
137
-
138
-
139
-
140
-
141
-
142
-
143
-
144
-
145
-
146
-
147
-
148
-
149
-
150
-
151
-
 152
152 -
 153
153 -
 154
154 -
 155
155 -
 156
156 -
 157
157 -
 158
158 -
 159
159 -
 160
160 -
 161
161 -
 162
162 -
 163
163 -
 164
164 -
 165
165 -
 166
166 -
 167
167 -
 168
168 -
 169
169 -
 170
170 -
 171
171 -
 172
172 -
173
-
174
-
175
-
176
-
177
-
178
-
179
-
180
-
181
-
182
-
183
-
184
-
185
-
186
-
187
-
188
-
189
-
190
-
191
-
192
-
193
-
194
-
195
-
196
-
197
-
198
-
199
-
200
-
201
-
202
-
203
-
204
-
205
-
206
-
207
-
208
-
209
-
210
-
211
-
212
-
213
-
214
-
215
-
216
-
217
-
218
-
219
-
220
-
221
-
222
-
223
-
224
-
225
-
226
-
227
-
228
-
229
-
230
-
231
-
232
-
233
-
234
-
235
-
236
-
237
-
238
-
239
-
240
-
241
-
242
-
243
-
244
-
245
-
246
-
247
-
248
-
249
-
250
-
251
-
252
-
253
-
254
-
255
-
256
-
257
-
258
-
259
-
260
-
261
-
262
-
263
-
264
-
265
-
266
-
267
-
268
-
269
-
270
-
271
-
272
-
273
-
274
-
275
-
276
-
277
-
278
-
279
-
280
-
281
-
282
-
283
-
284
-
285
-
286
-
287
-
288
-
289
-
290
-
291
-
292
-
293
-
294
-
295
-
296
-
297
-
298
-
299
-
300
-
301
-
302
-
303
-
304
-
305
-
306
-
307
-
308
-
309
-
310
-
311
-
312
-
313
-
314
-
315
-
316
-
317
-
318
-
319
-
320
-
321
-
322
-
323
-
324
-
325
-
326
-
327
-
328
-
329
-
330
-
331
-
332
-
333
-
334
-
335
-
336
-
337
-
338
-
339
-
340
-
341
-
342
-
343
-
344
-
345
-
346
-
347
-
348
-
349
-
350
-
351
-
352
-
353
-
354
-
355
-
356
-
357
-
358
-
359
-
360
-
361
-
362
-
363
-
364
-
365
-
366
-
367
-
368
-
369
-
370
-
371
-
372
-
373
-
374
-
375
-
376
-
377
-
378
-
379
-
380
-
381
-
382
-
383
-
384
-
385
-
386
-
387
-
388
-
389
-
390
-
391
-
392
-
393
-
394
-
395
-
396
-
397
-
398
-
399
-
400
-
401
 |
 |

Table of Contents
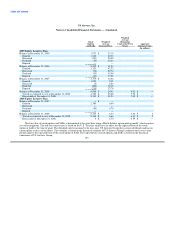
US Airways, Inc.
Notes to Consolidated Financial Statements — (Continued)
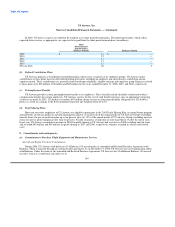
(a) Parent Company
The decrease in the net payable to US Airways Group was the result of the 2008 financing transactions and US Airways Group's
August 2008 equity offering.
US Airways recorded interest expense for the years ended December 31, 2008, 2007 and 2006 of $61 million, $86 million and
$70 million, respectively, related to the above transactions and other transactions with wholly owned subsidiaries of US Airways Group
as described below. Interest is calculated at market rates, which are reset quarterly.
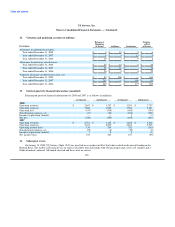
(b) Subsidiaries of US Airways Group
The net payable to US Airways Group's wholly owned subsidiaries consists of amounts due under regional capacity agreements
with the other airline subsidiaries and fuel purchase arrangements with a non-airline subsidiary.
US Airways purchases all of the capacity (ASMs) generated by US Airways Group's wholly owned regional airline subsidiaries at a
rate per ASM that is periodically determined by US Airways and, concurrently, recognizes revenues that result primarily from passengers
being carried by these affiliated companies. The rate per ASM that US Airways pays is based on estimates of the costs incurred to supply
the capacity. US Airways recognized US Airways Express capacity purchase expense for the years ended December 31, 2008, 2007 and
2006 of $417 million, $455 million and $433 million, respectively, related to this program.
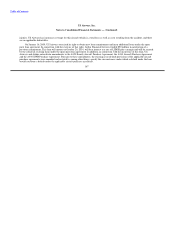
US Airways provides various services to these regional airlines, including passenger handling, maintenance and catering. US
Airways recognized other operating revenues for the years ended December 31, 2008, 2007 and 2006 of $89 million, $95 million and
$96 million, respectively, related to these services. These regional airlines also perform passenger and ground handling services for US
Airways at certain airports, for which US Airways recognized other operating expenses for the years ended December 31, 2008, 2007 and
2006 of $154 million, $156 million and $145 million, respectively. US Airways also leases or subleases certain aircraft to these regional
airline subsidiaries. US Airways recognized other operating revenues related to these arrangements for the years ended December 31,
2008, 2007 and 2006 of $78 million, $78 million and $80 million, respectively.
US Airways purchases a portion of its aviation fuel from US Airways Group's wholly owned subsidiary, MSC, which acts as a fuel
wholesaler to US Airways in certain circumstances. For the years ended December 31, 2008, 2007 and 2006, MSC sold fuel totaling
$1.33 billion, $1.02 billion and $810 million, respectively, used by US Airways' mainline and Express flights.
12. Operating segments and related disclosures
US Airways is managed as a single business unit that provides air transportation for passengers and cargo. This allows it to benefit
from an integrated revenue pricing and route network that includes US Airways, Piedmont, PSA and third-party carriers that fly under
capacity purchase or prorate agreements as part of US Airways' Express operations. The flight equipment of all these carriers is combined
to form one fleet that is deployed through a single route scheduling system. When making resource allocation decisions, the chief
operating decision maker evaluates flight profitability data, which considers aircraft type and route economics, but gives no weight to the
financial impact of the resource allocation decision on an individual carrier basis. The objective in making resource allocation decisions is
to maximize consolidated financial results, not the individual results of US Airways and US Airways Express.
160