US Airways 2008 Annual Report Download - page 132
Download and view the complete annual report
Please find page 132 of the 2008 US Airways annual report below. You can navigate through the pages in the report by either clicking on the pages listed below, or by using the keyword search tool below to find specific information within the annual report.-
 1
1 -
2
-
3
-
4
-
5
-
6
-
7
-
8
-
9
-
10
-
11
-
12
-
13
-
14
-
15
-
16
-
17
-
18
-
19
-
20
-
21
-
22
-
23
-
24
-
25
-
26
-
27
-
28
-
29
-
30
-
31
-
32
-
33
-
34
-
35
-
36
-
37
-
38
-
39
-
40
-
41
-
42
-
43
-
44
-
45
-
46
-
47
-
48
-
49
-
50
-
51
-
52
-
53
-
54
-
55
-
56
-
57
-
58
-
59
-
60
-
61
-
62
-
63
-
64
-
65
-
66
-
67
-
68
-
69
-
70
-
71
-
72
-
73
-
74
-
75
-
76
-
77
-
78
-
79
-
80
-
81
-
82
-
83
-
84
-
85
-
86
-
87
-
88
-
89
-
90
-
91
-
92
-
93
-
94
-
95
-
96
-
97
-
98
-
99
-
100
-
101
-
102
-
103
-
104
-
105
-
106
-
107
-
108
-
109
-
110
-
111
-
112
-
113
-
114
-
115
-
116
-
117
-
118
-
119
-
120
-
121
-
 122
122 -
 123
123 -
 124
124 -
 125
125 -
 126
126 -
 127
127 -
 128
128 -
 129
129 -
 130
130 -
 131
131 -
 132
132 -
 133
133 -
 134
134 -
 135
135 -
 136
136 -
 137
137 -
 138
138 -
 139
139 -
 140
140 -
 141
141 -
 142
142 -
143
-
144
-
145
-
146
-
147
-
148
-
149
-
150
-
151
-
152
-
153
-
154
-
155
-
156
-
157
-
158
-
159
-
160
-
161
-
162
-
163
-
164
-
165
-
166
-
167
-
168
-
169
-
170
-
171
-
172
-
173
-
174
-
175
-
176
-
177
-
178
-
179
-
180
-
181
-
182
-
183
-
184
-
185
-
186
-
187
-
188
-
189
-
190
-
191
-
192
-
193
-
194
-
195
-
196
-
197
-
198
-
199
-
200
-
201
-
202
-
203
-
204
-
205
-
206
-
207
-
208
-
209
-
210
-
211
-
212
-
213
-
214
-
215
-
216
-
217
-
218
-
219
-
220
-
221
-
222
-
223
-
224
-
225
-
226
-
227
-
228
-
229
-
230
-
231
-
232
-
233
-
234
-
235
-
236
-
237
-
238
-
239
-
240
-
241
-
242
-
243
-
244
-
245
-
246
-
247
-
248
-
249
-
250
-
251
-
252
-
253
-
254
-
255
-
256
-
257
-
258
-
259
-
260
-
261
-
262
-
263
-
264
-
265
-
266
-
267
-
268
-
269
-
270
-
271
-
272
-
273
-
274
-
275
-
276
-
277
-
278
-
279
-
280
-
281
-
282
-
283
-
284
-
285
-
286
-
287
-
288
-
289
-
290
-
291
-
292
-
293
-
294
-
295
-
296
-
297
-
298
-
299
-
300
-
301
-
302
-
303
-
304
-
305
-
306
-
307
-
308
-
309
-
310
-
311
-
312
-
313
-
314
-
315
-
316
-
317
-
318
-
319
-
320
-
321
-
322
-
323
-
324
-
325
-
326
-
327
-
328
-
329
-
330
-
331
-
332
-
333
-
334
-
335
-
336
-
337
-
338
-
339
-
340
-
341
-
342
-
343
-
344
-
345
-
346
-
347
-
348
-
349
-
350
-
351
-
352
-
353
-
354
-
355
-
356
-
357
-
358
-
359
-
360
-
361
-
362
-
363
-
364
-
365
-
366
-
367
-
368
-
369
-
370
-
371
-
372
-
373
-
374
-
375
-
376
-
377
-
378
-
379
-
380
-
381
-
382
-
383
-
384
-
385
-
386
-
387
-
388
-
389
-
390
-
391
-
392
-
393
-
394
-
395
-
396
-
397
-
398
-
399
-
400
-
401
 |
 |

Table of Contents
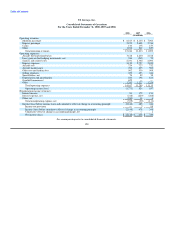
US Airways, Inc.
Consolidated Statements of Cash Flows
For the Years Ended December 31, 2008, 2007 and 2006
2008 2007 2006
(In millions)
Cash flows from operating activities:
Net income (loss) $ (2,148) $ 478 $ 349
Adjustments to reconcile net income (loss) to net cash provided by (used in) operating activities:
Cumulative effect of change in accounting principle — — (1)
Depreciation and amortization 224 198 183
Loss (gain) on dispositions of property and equipment 7 — (1)
Gain on forgiveness of debt (8) — (90)
Gain on sale of investments (1) (17) —
Goodwill impairment 622 — —
Impairment on auction rate securities 214 10 —
Impairment on fixed assets 13 — —
Utilization of acquired net operating loss carryforwards — 7 85
Change in the fair value of fuel hedging instruments, net 496 (187) 70
Amortization of deferred credits and rent (40) (40) (38)
Amortization of debt discount and issuance costs 15 13 13
Amortization of actuarial gains (2) — —
Debt extinguishment costs 6 — 5
Changes in operating assets and liabilities:
Decrease (increase) in restricted cash (184) (1) 6
Decrease (increase) in accounts receivables, net 68 17 (36)
Decrease (increase) in materials and supplies, net 35 (2) (16)
Decrease (increase) in prepaid expenses and other (270) (55) 37
Decrease (increase) in other assets, net 3 (5) 8
Increase (decrease) in accounts payable 114 (26) 16
Decrease in payables to related parties, net (31) (28) —
Increase (decrease) in air traffic liability (134) (22) 59
Increase (decrease) in accrued compensation and vacation (67) (36) 49
Increase (decrease) in accrued taxes (16) (22) 36
Increase (decrease) in other liabilities 59 151 (82)
Net cash provided by (used in) operating activities (1,025) 433 652
Cash flows from investing activities:
Purchases of property and equipment (902) (486) (222)
Purchases of marketable securities (299) (2,591) (2,583)
Sales of marketable securities 505 3,203 1,785
Proceeds from sale of other investments 4 56 —
Decrease (increase) in long-term restricted cash (74) 200 128
Proceeds from dispositions of property and equipment 16 4 7
Increase in equipment purchase deposits (139) (80) (8)
Net cash provided by (used in) investing activities (889) 306 (893)
Cash flows from financing activities:
Repayments of debt and capital lease obligations (318) (105) (100)
Proceeds from issuance of debt 1,386 198 92
Deferred financing costs (17) (3) (3)
Increase (decrease) in payables to related parties, net (51) — 247
Net cash provided by financing activities 1,000 90 236
Net increase (decrease) in cash and cash equivalents (914) 829 (5)
Cash and cash equivalents at beginning of year 1,940 1,111 1,116
Cash and cash equivalents at end of year $ 1,026 $ 1,940 $ 1,111
See accompanying notes to consolidated financial statements.
130