US Airways 2008 Annual Report Download - page 50
Download and view the complete annual report
Please find page 50 of the 2008 US Airways annual report below. You can navigate through the pages in the report by either clicking on the pages listed below, or by using the keyword search tool below to find specific information within the annual report.-
 1
1 -
2
-
3
-
4
-
5
-
6
-
7
-
8
-
9
-
10
-
11
-
12
-
13
-
14
-
15
-
16
-
17
-
18
-
19
-
20
-
21
-
22
-
23
-
24
-
25
-
26
-
27
-
28
-
29
-
30
-
31
-
32
-
33
-
34
-
35
-
36
-
37
-
38
-
39
-
 40
40 -
 41
41 -
 42
42 -
 43
43 -
 44
44 -
 45
45 -
 46
46 -
 47
47 -
 48
48 -
 49
49 -
 50
50 -
 51
51 -
 52
52 -
 53
53 -
 54
54 -
 55
55 -
 56
56 -
 57
57 -
 58
58 -
 59
59 -
 60
60 -
61
-
62
-
63
-
64
-
65
-
66
-
67
-
68
-
69
-
70
-
71
-
72
-
73
-
74
-
75
-
76
-
77
-
78
-
79
-
80
-
81
-
82
-
83
-
84
-
85
-
86
-
87
-
88
-
89
-
90
-
91
-
92
-
93
-
94
-
95
-
96
-
97
-
98
-
99
-
100
-
101
-
102
-
103
-
104
-
105
-
106
-
107
-
108
-
109
-
110
-
111
-
112
-
113
-
114
-
115
-
116
-
117
-
118
-
119
-
120
-
121
-
122
-
123
-
124
-
125
-
126
-
127
-
128
-
129
-
130
-
131
-
132
-
133
-
134
-
135
-
136
-
137
-
138
-
139
-
140
-
141
-
142
-
143
-
144
-
145
-
146
-
147
-
148
-
149
-
150
-
151
-
152
-
153
-
154
-
155
-
156
-
157
-
158
-
159
-
160
-
161
-
162
-
163
-
164
-
165
-
166
-
167
-
168
-
169
-
170
-
171
-
172
-
173
-
174
-
175
-
176
-
177
-
178
-
179
-
180
-
181
-
182
-
183
-
184
-
185
-
186
-
187
-
188
-
189
-
190
-
191
-
192
-
193
-
194
-
195
-
196
-
197
-
198
-
199
-
200
-
201
-
202
-
203
-
204
-
205
-
206
-
207
-
208
-
209
-
210
-
211
-
212
-
213
-
214
-
215
-
216
-
217
-
218
-
219
-
220
-
221
-
222
-
223
-
224
-
225
-
226
-
227
-
228
-
229
-
230
-
231
-
232
-
233
-
234
-
235
-
236
-
237
-
238
-
239
-
240
-
241
-
242
-
243
-
244
-
245
-
246
-
247
-
248
-
249
-
250
-
251
-
252
-
253
-
254
-
255
-
256
-
257
-
258
-
259
-
260
-
261
-
262
-
263
-
264
-
265
-
266
-
267
-
268
-
269
-
270
-
271
-
272
-
273
-
274
-
275
-
276
-
277
-
278
-
279
-
280
-
281
-
282
-
283
-
284
-
285
-
286
-
287
-
288
-
289
-
290
-
291
-
292
-
293
-
294
-
295
-
296
-
297
-
298
-
299
-
300
-
301
-
302
-
303
-
304
-
305
-
306
-
307
-
308
-
309
-
310
-
311
-
312
-
313
-
314
-
315
-
316
-
317
-
318
-
319
-
320
-
321
-
322
-
323
-
324
-
325
-
326
-
327
-
328
-
329
-
330
-
331
-
332
-
333
-
334
-
335
-
336
-
337
-
338
-
339
-
340
-
341
-
342
-
343
-
344
-
345
-
346
-
347
-
348
-
349
-
350
-
351
-
352
-
353
-
354
-
355
-
356
-
357
-
358
-
359
-
360
-
361
-
362
-
363
-
364
-
365
-
366
-
367
-
368
-
369
-
370
-
371
-
372
-
373
-
374
-
375
-
376
-
377
-
378
-
379
-
380
-
381
-
382
-
383
-
384
-
385
-
386
-
387
-
388
-
389
-
390
-
391
-
392
-
393
-
394
-
395
-
396
-
397
-
398
-
399
-
400
-
401
 |
 |

Table of Contents
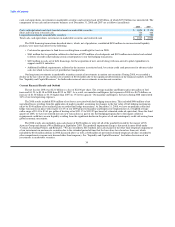
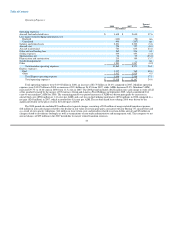
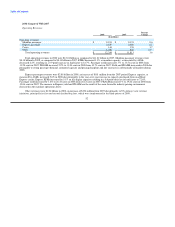
The table below sets forth the major components of our mainline CASM for the years ended December 31, 2007 and 2006:
Year Ended
December 31, Percent
2007 2006 Change
(In cents)
Mainline CASM:
Aircraft fuel and related taxes 3.47 3.27 6.0
Loss (gain) on fuel hedging instruments, net (0.32) 0.10 nm
Salaries and related costs 3.03 2.71 11.8
Aircraft rent 0.96 0.95 0.9
Aircraft maintenance 0.84 0.75 10.8
Other rent and landing fees 0.70 0.74 (4.3)
Selling expenses 0.60 0.58 3.1
Special items, net 0.13 0.04 nm
Depreciation and amortization 0.25 0.23 9.9
Other 1.64 1.59 3.5
Total Mainline CASM 11.30 10.96 3.1
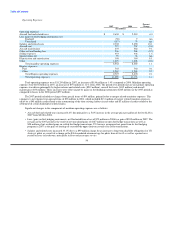
Significant changes in the components of mainline operating expense per ASM are as follows:
• Aircraft fuel and related taxes per ASM increased 6% due primarily to a 5.8% increase in the average price per gallon of fuel to
$2.20 in 2007 from $2.08 in 2006.
• Loss (gain) on fuel hedging instruments, net per ASM fluctuated from a loss of 0.10 cents in 2006 to a gain of 0.32 cents in 2007.
The net gain in the 2007 period is the result of net unrealized gains of $187 million on open fuel hedge transactions as well as
$58 million of net realized gains on settled fuel hedge transactions. We recognized net gains from our fuel hedging program in
2007 as the price of heating oil exceeded the upper limit on certain of our collar transactions.
• Salaries and related costs per ASM increased 11.8% due to a $99 million charge for an increase to long-term disability
obligations for US Airways' pilots as a result of a change in the FAA mandated retirement age for pilots from 60 to 65 as well as
a period over period increase in headcount, principally in fleet and passenger service employees as part of our initiative to
improve operational performance, and increases in employee benefits as a result of higher medical claims due to general
inflationary cost increases.
• Aircraft maintenance expense per ASM increased 10.8% due principally to an increase in the number of overhauls performed on
engines not subject to power by the hour maintenance agreements as well as an increase in the volume of seat overhauls and
thrust reverser repairs in the 2007 period compared to the 2006 period.
• Depreciation and amortization per ASM increased 9.9% due to the acquisition of nine Embraer 190 aircraft and equipment to
support flight operations in 2007, which increased depreciation expense on owned aircraft and equipment.
Total Express expenses increased 1.4% in 2007 to $2.59 billion from $2.56 billion in 2006, as other Express operating expenses
increased $34 million. Express fuel costs remained consistent period over period as the average fuel price per gallon increased 4.2% from
$2.14 in the 2006 period to $2.23 in the 2007 period, which was offset by a 4% decrease in gallons consumed as block hours were down
6.2% in the 2007 period due to planned reductions in Express flying. Other Express operating expenses increased as a result of higher
rates paid under certain capacity purchase agreements due to contractually scheduled rate changes.
48