US Airways 2008 Annual Report Download - page 15
Download and view the complete annual report
Please find page 15 of the 2008 US Airways annual report below. You can navigate through the pages in the report by either clicking on the pages listed below, or by using the keyword search tool below to find specific information within the annual report.-
 1
1 -
2
-
3
-
4
-
 5
5 -
 6
6 -
 7
7 -
 8
8 -
 9
9 -
 10
10 -
 11
11 -
 12
12 -
 13
13 -
 14
14 -
 15
15 -
 16
16 -
 17
17 -
 18
18 -
 19
19 -
 20
20 -
 21
21 -
 22
22 -
 23
23 -
 24
24 -
 25
25 -
26
-
27
-
28
-
29
-
30
-
31
-
32
-
33
-
34
-
35
-
36
-
37
-
38
-
39
-
40
-
41
-
42
-
43
-
44
-
45
-
46
-
47
-
48
-
49
-
50
-
51
-
52
-
53
-
54
-
55
-
56
-
57
-
58
-
59
-
60
-
61
-
62
-
63
-
64
-
65
-
66
-
67
-
68
-
69
-
70
-
71
-
72
-
73
-
74
-
75
-
76
-
77
-
78
-
79
-
80
-
81
-
82
-
83
-
84
-
85
-
86
-
87
-
88
-
89
-
90
-
91
-
92
-
93
-
94
-
95
-
96
-
97
-
98
-
99
-
100
-
101
-
102
-
103
-
104
-
105
-
106
-
107
-
108
-
109
-
110
-
111
-
112
-
113
-
114
-
115
-
116
-
117
-
118
-
119
-
120
-
121
-
122
-
123
-
124
-
125
-
126
-
127
-
128
-
129
-
130
-
131
-
132
-
133
-
134
-
135
-
136
-
137
-
138
-
139
-
140
-
141
-
142
-
143
-
144
-
145
-
146
-
147
-
148
-
149
-
150
-
151
-
152
-
153
-
154
-
155
-
156
-
157
-
158
-
159
-
160
-
161
-
162
-
163
-
164
-
165
-
166
-
167
-
168
-
169
-
170
-
171
-
172
-
173
-
174
-
175
-
176
-
177
-
178
-
179
-
180
-
181
-
182
-
183
-
184
-
185
-
186
-
187
-
188
-
189
-
190
-
191
-
192
-
193
-
194
-
195
-
196
-
197
-
198
-
199
-
200
-
201
-
202
-
203
-
204
-
205
-
206
-
207
-
208
-
209
-
210
-
211
-
212
-
213
-
214
-
215
-
216
-
217
-
218
-
219
-
220
-
221
-
222
-
223
-
224
-
225
-
226
-
227
-
228
-
229
-
230
-
231
-
232
-
233
-
234
-
235
-
236
-
237
-
238
-
239
-
240
-
241
-
242
-
243
-
244
-
245
-
246
-
247
-
248
-
249
-
250
-
251
-
252
-
253
-
254
-
255
-
256
-
257
-
258
-
259
-
260
-
261
-
262
-
263
-
264
-
265
-
266
-
267
-
268
-
269
-
270
-
271
-
272
-
273
-
274
-
275
-
276
-
277
-
278
-
279
-
280
-
281
-
282
-
283
-
284
-
285
-
286
-
287
-
288
-
289
-
290
-
291
-
292
-
293
-
294
-
295
-
296
-
297
-
298
-
299
-
300
-
301
-
302
-
303
-
304
-
305
-
306
-
307
-
308
-
309
-
310
-
311
-
312
-
313
-
314
-
315
-
316
-
317
-
318
-
319
-
320
-
321
-
322
-
323
-
324
-
325
-
326
-
327
-
328
-
329
-
330
-
331
-
332
-
333
-
334
-
335
-
336
-
337
-
338
-
339
-
340
-
341
-
342
-
343
-
344
-
345
-
346
-
347
-
348
-
349
-
350
-
351
-
352
-
353
-
354
-
355
-
356
-
357
-
358
-
359
-
360
-
361
-
362
-
363
-
364
-
365
-
366
-
367
-
368
-
369
-
370
-
371
-
372
-
373
-
374
-
375
-
376
-
377
-
378
-
379
-
380
-
381
-
382
-
383
-
384
-
385
-
386
-
387
-
388
-
389
-
390
-
391
-
392
-
393
-
394
-
395
-
396
-
397
-
398
-
399
-
400
-
401
 |
 |

Table of Contents
On November 21, 2008, the National Mediation Board notified us that an application for representation of the Customer Service
Training Instructors had been filed by the TWU. We responded that the appropriate craft or class should also include the Fleet Service
Training Instructors. The National Mediation Board conducted an investigation and determined that the craft or class includes both
Customer Service and Fleet Service Training Instructors. Further, the National Mediation Board ordered a representation election with
voting beginning on January 29, 2009 and concluding on February 20, 2009.
There are few remaining unrepresented employee groups that could engage in organization efforts. We cannot predict the outcome
of any future efforts to organize those remaining employees or the terms of any future labor agreements or the effect, if any, on US
Airways' operations or financial performance. For more discussion, see Item 1A. "Risk Factors — Risk Factors Relating to the Company
and Industry Related Risks — Union disputes, employee strikes and other labor-related disruptions may adversely affect our operations."
Aviation Fuel
In 2008, aviation fuel was our largest expense. The average cost of a gallon of aviation fuel for our mainline and Express operations
increased 44.1% from 2007 to 2008, and our total mainline and Express fuel expense increased $1.36 billion or 40.1% from 2007 to
2008. We estimate that a one cent per gallon change in fuel prices will result in a $14 million increase/decrease in annual fuel expense.
While there has been recent relief in the price of oil, the cost of fuel remains volatile. Because the operations of our airline are dependent
upon aviation fuel, increases in aviation fuel costs could materially and adversely affect liquidity, results of operations and financial
condition.
We currently utilize heating-oil based derivative instruments to hedge a portion of our exposure to oil price increases. As of
December 31, 2008, we had entered into fuel hedging transactions using no premium collars, which establish an upper and lower limit on
heating oil futures prices. These transactions are in place with respect to approximately 14% of our 2009 fuel consumption requirements.
Since the third quarter of 2008, we have not entered into any new transactions as part of our fuel hedging program due to the impact
collateral requirements could have on our liquidity resulting from the significant decline in the price of oil and counterparty credit risk
arising from global economic uncertainty. During 2008, 2007 and 2006, we recognized a net loss of $356 million, a net gain of
$245 million and a net loss of $79 million, respectively, related to fuel hedging activities. The 2008 net loss on our fuel hedging
derivatives was driven by the significant decline in the price of oil in the latter part of 2008.
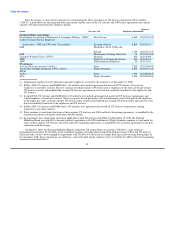
The following table shows annual aircraft fuel consumption and costs for our mainline operations for 2006 through 2008 (gallons
and aircraft fuel expense in millions):
Average Price Aircraft Fuel Percentage of Total
Year Gallons per Gallon(1) Expense(1) Operating Expenses
2008 1,142 $ 3.17 $ 3,618 33.3%
2007 1,195 2.20 2,630 30.7%
2006 1,210 2.08 2,518 29.8%
(1) Includes fuel taxes and excludes the impact of fuel hedges. The impact of fuel hedges is described in Item 7 under "US Airways
Group's Results of Operations" and "US Airways' Results of Operations."
In addition, we incur fuel expenses related to our Express operations. For the years ended December 31, 2008, 2007 and 2006, total
fuel expenses for US Airways Group's wholly owned regional airlines, affiliate regional airlines operating under capacity purchase
agreements as US Airways Express, and US Airways' former MidAtlantic division was $1.14 billion, $765 million and $764 million,
respectively.
Prices and availability of all petroleum products are subject to political, economic and market factors that are generally outside of
our control. Accordingly, the price and availability of aviation fuel, as well as other petroleum products, can be unpredictable. Prices may
be affected by many factors, including:
• the impact of global political instability on crude production;
• unexpected changes to the availability of petroleum products due to disruptions in distribution systems or refineries, as evidenced
in the third quarter of 2005 when Hurricane Katrina and Hurricane Rita caused
13