US Airways 2008 Annual Report Download - page 83
Download and view the complete annual report
Please find page 83 of the 2008 US Airways annual report below. You can navigate through the pages in the report by either clicking on the pages listed below, or by using the keyword search tool below to find specific information within the annual report.-
 1
1 -
2
-
3
-
4
-
5
-
6
-
7
-
8
-
9
-
10
-
11
-
12
-
13
-
14
-
15
-
16
-
17
-
18
-
19
-
20
-
21
-
22
-
23
-
24
-
25
-
26
-
27
-
28
-
29
-
30
-
31
-
32
-
33
-
34
-
35
-
36
-
37
-
38
-
39
-
40
-
41
-
42
-
43
-
44
-
45
-
46
-
47
-
48
-
49
-
50
-
51
-
52
-
53
-
54
-
55
-
56
-
57
-
58
-
59
-
60
-
61
-
62
-
63
-
64
-
65
-
66
-
67
-
68
-
69
-
70
-
71
-
72
-
 73
73 -
 74
74 -
 75
75 -
 76
76 -
 77
77 -
 78
78 -
 79
79 -
 80
80 -
 81
81 -
 82
82 -
 83
83 -
 84
84 -
 85
85 -
 86
86 -
 87
87 -
 88
88 -
 89
89 -
 90
90 -
 91
91 -
 92
92 -
 93
93 -
94
-
95
-
96
-
97
-
98
-
99
-
100
-
101
-
102
-
103
-
104
-
105
-
106
-
107
-
108
-
109
-
110
-
111
-
112
-
113
-
114
-
115
-
116
-
117
-
118
-
119
-
120
-
121
-
122
-
123
-
124
-
125
-
126
-
127
-
128
-
129
-
130
-
131
-
132
-
133
-
134
-
135
-
136
-
137
-
138
-
139
-
140
-
141
-
142
-
143
-
144
-
145
-
146
-
147
-
148
-
149
-
150
-
151
-
152
-
153
-
154
-
155
-
156
-
157
-
158
-
159
-
160
-
161
-
162
-
163
-
164
-
165
-
166
-
167
-
168
-
169
-
170
-
171
-
172
-
173
-
174
-
175
-
176
-
177
-
178
-
179
-
180
-
181
-
182
-
183
-
184
-
185
-
186
-
187
-
188
-
189
-
190
-
191
-
192
-
193
-
194
-
195
-
196
-
197
-
198
-
199
-
200
-
201
-
202
-
203
-
204
-
205
-
206
-
207
-
208
-
209
-
210
-
211
-
212
-
213
-
214
-
215
-
216
-
217
-
218
-
219
-
220
-
221
-
222
-
223
-
224
-
225
-
226
-
227
-
228
-
229
-
230
-
231
-
232
-
233
-
234
-
235
-
236
-
237
-
238
-
239
-
240
-
241
-
242
-
243
-
244
-
245
-
246
-
247
-
248
-
249
-
250
-
251
-
252
-
253
-
254
-
255
-
256
-
257
-
258
-
259
-
260
-
261
-
262
-
263
-
264
-
265
-
266
-
267
-
268
-
269
-
270
-
271
-
272
-
273
-
274
-
275
-
276
-
277
-
278
-
279
-
280
-
281
-
282
-
283
-
284
-
285
-
286
-
287
-
288
-
289
-
290
-
291
-
292
-
293
-
294
-
295
-
296
-
297
-
298
-
299
-
300
-
301
-
302
-
303
-
304
-
305
-
306
-
307
-
308
-
309
-
310
-
311
-
312
-
313
-
314
-
315
-
316
-
317
-
318
-
319
-
320
-
321
-
322
-
323
-
324
-
325
-
326
-
327
-
328
-
329
-
330
-
331
-
332
-
333
-
334
-
335
-
336
-
337
-
338
-
339
-
340
-
341
-
342
-
343
-
344
-
345
-
346
-
347
-
348
-
349
-
350
-
351
-
352
-
353
-
354
-
355
-
356
-
357
-
358
-
359
-
360
-
361
-
362
-
363
-
364
-
365
-
366
-
367
-
368
-
369
-
370
-
371
-
372
-
373
-
374
-
375
-
376
-
377
-
378
-
379
-
380
-
381
-
382
-
383
-
384
-
385
-
386
-
387
-
388
-
389
-
390
-
391
-
392
-
393
-
394
-
395
-
396
-
397
-
398
-
399
-
400
-
401
 |
 |
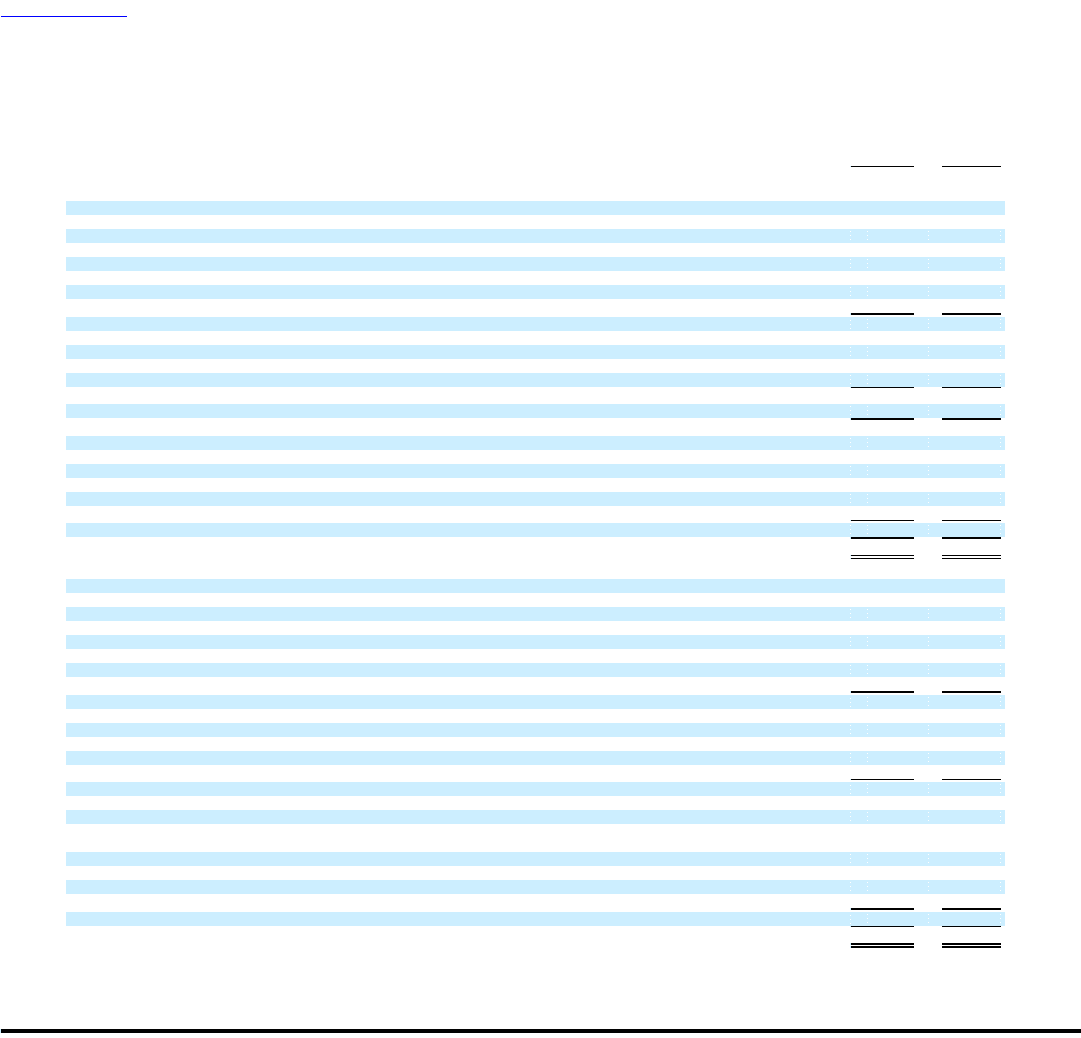
Table of Contents
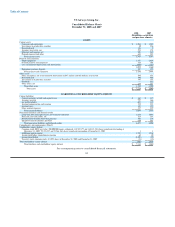
US Airways Group, Inc.
Consolidated Balance Sheets
December 31, 2008 and 2007
2008 2007
(In millions, except share
and per share amounts)
ASSETS
Current assets
Cash and cash equivalents $ 1,034 $ 1,948
Investments in marketable securities 20 226
Restricted cash 186 2
Accounts receivable, net 293 374
Materials and supplies, net 201 249
Prepaid expenses and other 684 548
Total current assets 2,418 3,347
Property and equipment
Flight equipment 3,157 2,414
Ground property and equipment 816 703
Less accumulated depreciation and amortization (954) (757)
3,019 2,360
Equipment purchase deposits 267 128
Total property and equipment 3,286 2,488
Other assets
Other intangibles, net of accumulated amortization of $87 million and $62 million, respectively 545 553
Restricted cash 540 466
Investments in marketable securities 187 353
Goodwill — 622
Other assets, net 238 211
Total other assets 1,510 2,205
Total assets $ 7,214 $ 8,040
LIABILITIES & STOCKHOLDERS' EQUITY (DEFICIT)
Current liabilities
Current maturities of debt and capital leases $ 362 $ 117
Accounts payable 797 366
Air traffic liability 698 832
Accrued compensation and vacation 158 225
Accrued taxes 142 152
Other accrued expenses 887 859
Total current liabilities 3,044 2,551
Noncurrent liabilities and deferred credits
Long-term debt and capital leases, net of current maturities 3,634 3,031
Deferred gains and credits, net 323 318
Postretirement benefits other than pensions 108 138
Employee benefit liabilities and other 610 563
Total noncurrent liabilities and deferred credits 4,675 4,050
Commitments and contingencies (Note 9)
Stockholders' equity (deficit)
Common stock, $0.01 par value; 200,000,000 shares authorized, 114,527,377 and 114,113,384 shares issued and outstanding at
December 31, 2008; 92,278,557 and 91,864,564 shares issued and outstanding at December 31, 2007 1 1
Additional paid-in capital 1,749 1,536
Accumulated other comprehensive income 65 10
Accumulated deficit (2,307) (95)
Treasury stock, common stock, 413,993 shares at December 31, 2008 and December 31, 2007 (13) (13)
Total stockholders' equity (deficit) (505) 1,439
Total liabilities and stockholders' equity (deficit) $ 7,214 $ 8,040
See accompanying notes to consolidated financial statements.
81