US Airways 2008 Annual Report Download - page 17
Download and view the complete annual report
Please find page 17 of the 2008 US Airways annual report below. You can navigate through the pages in the report by either clicking on the pages listed below, or by using the keyword search tool below to find specific information within the annual report.-
 1
1 -
2
-
3
-
4
-
5
-
6
-
 7
7 -
 8
8 -
 9
9 -
 10
10 -
 11
11 -
 12
12 -
 13
13 -
 14
14 -
 15
15 -
 16
16 -
 17
17 -
 18
18 -
 19
19 -
 20
20 -
 21
21 -
 22
22 -
 23
23 -
 24
24 -
 25
25 -
 26
26 -
 27
27 -
28
-
29
-
30
-
31
-
32
-
33
-
34
-
35
-
36
-
37
-
38
-
39
-
40
-
41
-
42
-
43
-
44
-
45
-
46
-
47
-
48
-
49
-
50
-
51
-
52
-
53
-
54
-
55
-
56
-
57
-
58
-
59
-
60
-
61
-
62
-
63
-
64
-
65
-
66
-
67
-
68
-
69
-
70
-
71
-
72
-
73
-
74
-
75
-
76
-
77
-
78
-
79
-
80
-
81
-
82
-
83
-
84
-
85
-
86
-
87
-
88
-
89
-
90
-
91
-
92
-
93
-
94
-
95
-
96
-
97
-
98
-
99
-
100
-
101
-
102
-
103
-
104
-
105
-
106
-
107
-
108
-
109
-
110
-
111
-
112
-
113
-
114
-
115
-
116
-
117
-
118
-
119
-
120
-
121
-
122
-
123
-
124
-
125
-
126
-
127
-
128
-
129
-
130
-
131
-
132
-
133
-
134
-
135
-
136
-
137
-
138
-
139
-
140
-
141
-
142
-
143
-
144
-
145
-
146
-
147
-
148
-
149
-
150
-
151
-
152
-
153
-
154
-
155
-
156
-
157
-
158
-
159
-
160
-
161
-
162
-
163
-
164
-
165
-
166
-
167
-
168
-
169
-
170
-
171
-
172
-
173
-
174
-
175
-
176
-
177
-
178
-
179
-
180
-
181
-
182
-
183
-
184
-
185
-
186
-
187
-
188
-
189
-
190
-
191
-
192
-
193
-
194
-
195
-
196
-
197
-
198
-
199
-
200
-
201
-
202
-
203
-
204
-
205
-
206
-
207
-
208
-
209
-
210
-
211
-
212
-
213
-
214
-
215
-
216
-
217
-
218
-
219
-
220
-
221
-
222
-
223
-
224
-
225
-
226
-
227
-
228
-
229
-
230
-
231
-
232
-
233
-
234
-
235
-
236
-
237
-
238
-
239
-
240
-
241
-
242
-
243
-
244
-
245
-
246
-
247
-
248
-
249
-
250
-
251
-
252
-
253
-
254
-
255
-
256
-
257
-
258
-
259
-
260
-
261
-
262
-
263
-
264
-
265
-
266
-
267
-
268
-
269
-
270
-
271
-
272
-
273
-
274
-
275
-
276
-
277
-
278
-
279
-
280
-
281
-
282
-
283
-
284
-
285
-
286
-
287
-
288
-
289
-
290
-
291
-
292
-
293
-
294
-
295
-
296
-
297
-
298
-
299
-
300
-
301
-
302
-
303
-
304
-
305
-
306
-
307
-
308
-
309
-
310
-
311
-
312
-
313
-
314
-
315
-
316
-
317
-
318
-
319
-
320
-
321
-
322
-
323
-
324
-
325
-
326
-
327
-
328
-
329
-
330
-
331
-
332
-
333
-
334
-
335
-
336
-
337
-
338
-
339
-
340
-
341
-
342
-
343
-
344
-
345
-
346
-
347
-
348
-
349
-
350
-
351
-
352
-
353
-
354
-
355
-
356
-
357
-
358
-
359
-
360
-
361
-
362
-
363
-
364
-
365
-
366
-
367
-
368
-
369
-
370
-
371
-
372
-
373
-
374
-
375
-
376
-
377
-
378
-
379
-
380
-
381
-
382
-
383
-
384
-
385
-
386
-
387
-
388
-
389
-
390
-
391
-
392
-
393
-
394
-
395
-
396
-
397
-
398
-
399
-
400
-
401
 |
 |

Table of Contents
improvement from our 2007 rate of 8.47. Our rate of customer complaints filed with the DOT per 100,000 passengers also improved,
decreasing to 2.01 in 2008 from 3.16 in 2007.
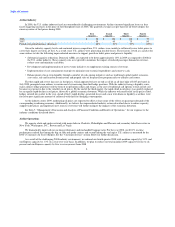
We reported the following combined operating statistics to the DOT for mainline operations for the years ended December 31,
2008, 2007 and 2006:
Full Year
2008 2007 2006
On-time performance(a) 80.1 68.7 76.9
Completion factor(b) 98.5 98.2 98.9
Mishandled baggage(c) 4.77 8.47 7.88
Customer complaints(d) 2.01 3.16 1.36
(a) Percentage of reported flight operations arriving on time as defined by the DOT.
(b) Percentage of scheduled flight operations completed.
(c) Rate of mishandled baggage reports per 1,000 passengers.
(d) Rate of customer complaints filed with the DOT per 100,000 passengers.
Frequent Traveler Program
All major United States airlines offer frequent flyer programs to encourage travel on their respective airlines and customer loyalty.
Our Dividend Miles frequent flyer program allows participants to earn mileage credits for each paid flight segment on US Airways, Star
Alliance carriers and certain other airlines that participate in the program. Participants flying in first class or Envoy class may receive
additional mileage credits. Participants can also receive mileage credits through special promotions that we periodically offer and may
also earn mileage credits by utilizing certain credit cards and purchasing services from non-airline partners such as hotels and rental car
agencies. We sell mileage credits to credit card companies, telephone companies, hotels, car rental agencies and others that participate in
the Dividend Miles program. Mileage credits can be redeemed for a travel award or first class upgrades on US Airways, Star Alliance
carriers or other participating airlines.
We and the other participating airline partners limit the number of seats allocated per flight for award recipients by using various
inventory management techniques. Award travel for all but the highest-level Dividend Miles participants is generally not permitted on
blackout dates, which correspond to certain holiday periods or peak travel dates. We reserve the right to terminate Dividend Miles or
portions of the program at any time. Program rules, partners, special offers, blackout dates, awards and requisite mileage levels for
awards are subject to change. In 2008, we implemented processing fees for issuing awards ranging from $25 to $50 depending on
destination, as well as a $50 to $75 fee for redeeming awards within 14 days of the travel date depending on booking method.
Ticket Distribution
Passengers can book tickets for travel on US Airways through several distribution channels including our direct website
(www.usairways.com), online travel agent sites (e.g., Orbitz, Travelocity, Expedia and others), traditional travel agents, reservations
centers and airline ticket offices. Traditional travel agencies use Global Distribution Systems ("GDSs"), such as Sabre Travel Network®,
to obtain their fare and inventory data from airlines. Bookings made through these agencies result in a fee, referred to as a "GDS fee,"
that is charged to the airline. Bookings made directly with an airline, through its reservation call centers or website, do not generate a
GDS fee. Travel agent sites that connect directly to airline host systems, effectively by-passing the traditional connection via GDSs, help
us reduce distribution costs. In 2008, we received 57% of our sales from internet sites. Our website accounted for 25% of our sales, while
other internet sites accounted for 32% of our sales.
During 2008, electronic tickets represented 99% of all tickets issued to customers flying US Airways. Electronic tickets serve to
enhance customer service and control costs for ticketing services supported by the airline and its distribution partners. Our $50 surcharge
to most customers requiring paper tickets has allowed us to continue to support exceptional requests, while offsetting any cost variance
associated with the issuance and postal fulfillment of paper tickets.
15